Premium & Discount Delta Volume [BigBeluga]Premium & Discount Delta Volume is an advanced volume-based tool that helps traders identify zones of market imbalances by using the concepts of premium and discount pricing, commonly taught by ICT trader. It calculates and highlights periods where the market is trading at a premium (selling pressure is stronger) or a discount (buying pressure is stronger) and dynamically plots these zones over time. The indicator also calculates delta volume between buying and selling within these zones, showing shifts in market sentiment and potential areas for reversals or continuations.
🔵 IDEA
The Premium & Discount Delta Volume indicator is rooted in the ICT (Inner Circle Trader) concept of premium and discount zones. This concept divides the price action into two key zones:
Premium Zone : This area is where the market is trading at a level where sellers dominate, leading to more selling pressure. The idea is that the price is overvalued, and a potential drop could occur as the market reverts to a balanced state.
Discount Zone : This area is where the market is undervalued, with buyers dominating and applying upward pressure. Prices in this area often indicate opportunities to buy into strength as the market moves back to equilibrium.
At the core of the indicator is the delta volume, which measures the difference between buying and selling pressure within the premium and discount zones. When the delta volume is negative, it signals a downtrend with more selling pressure, while a positive delta volume signals an uptrend with more buying pressure. These zones and their associated delta values update dynamically, providing traders with real-time insights into market strength and potential price reversals.
The equilibrium in the middle of the premium and discount zones represents the balance point between buyers and sellers. When price moves away from equilibrium, it either enters the premium zone (potentially overbought) or the discount zone (potentially oversold), helping traders make more informed decisions based on volume and price structure.
🔵 KEY FEATURES & USAGE
Premium & Discount Zones:
The indicator automatically identifies and plots premium and discount zones on the chart. Premium zones count only negative (selling) volume, while discount zones count only positive (buying) volume. These zones are key areas of interest for identifying potential price reversals or continuations based on volume pressure.
Dynamic Delta Volume Calculation:
The indicator calculates delta volume between the premium and discount zones, showing the imbalance between buyers and sellers. A positive delta volume inside the discount zone suggests strong buying pressure, while a negative delta inside the premium zone suggests strong selling pressure. This helps traders quickly identify trends or market exhaustion.
Up Trend:
Down Trend:
Real-time Updates & Equilibrium Line:
The zones update dynamically every 100 bars or after price crosses them, ensuring that traders always have the most relevant market data. The equilibrium line in the middle of the zones helps traders gauge whether the market is balanced or moving into overbought (premium) or oversold (discount) territory.
Macro and Local Period Calculations:
The indicator allows traders to customize two different periods for analysis: a smaller lookback period (e.g., 50 bars) for short-term price action and a macro period (e.g., 200 bars) for larger trends. Each period has its own premium and discount zones, allowing for a multi-timeframe view of market strength.
Macro:
Both:
Color-coded background for Volume Pressure:
The background color of the smaller period premium and discount box changes based on delta volume. A positive delta turns the background blue, indicating higher buy pressure, while a negative delta turns the background red, signaling higher sell pressure.
🔵 CUSTOMIZATION
Toggle Premium & Discount: Traders can choose to display support and resistance levels based on the high and low points of the premium and discount zones.
Premium & Discount Lookback Period: Traders can adjust the lookback period to define the length of price action to be analyzed for premium and discount zones. A shorter period focuses on more recent market activity, while a longer period provides a broader view of trends.
Macro Highs/Lows Period: The indicator also offers a macro lookback period for identifying larger market trends and key levels of buying or selling volume.
Toggle Macro Levels: Macro levels help identify long-term price extremes, and traders can toggle this feature on or off as needed.
Cari dalam skrip untuk "Inner circle trader "

Unicorn ICT Signals [TradingFinder] Breaker Block + FVG Zones🔵 Introduction
The "ICT Unicorn Model" trading strategy in the "Inner Circle Trader" (ICT) style is one of the well-known strategies in the world of Forex and financial market trading.
The ICT methodology was developed by Michael Huddleston and is based on technical analysis and Price Action concepts.
This style focuses specifically on interpreting price movements and identifying optimal entry and exit points in the market.
In the Unicorn strategy, traders seek points where the probability of price reversal or trend continuation is high. This strategy is primarily based on recognizing and analyzing Price Action patterns and market structure.
By understanding"ICT Unicorn Model", traders can make more informed decisions about where to enter or exit trades, thereby increasing their chances of success in the market.
🟣 Understanding the Breaker Block
A Breaker Block is a specialized form of an Order Block that changes its role after a key market level is broken. Typically, an Order Block is an area on the chart where large institutional orders are likely to be placed, providing strong support or resistance.
However, when this area is breached, and the price moves in the opposite direction, it transforms into what is known as a Breaker Block. This shift indicates a reversal in market sentiment, turning the previous support into resistance or vice versa, thereby signaling a potential trend change to traders.
🟣 The Significance of the Fair Value Gap (FVG)
The Fair Value Gap (FVG) refers to an area on a price chart where the price rapidly moves through a level, leaving behind a gap. This gap represents an imbalance between supply and demand and is often seen as a potential area for price to return and fill the gap.
These zones are crucial for traders as they can indicate future price movements, providing opportunities to enter or exit trades.
🟣 Defining the ICT Unicorn Model
When an FVG overlaps with a Breaker Block, it forms a highly significant trading area known as a Unicorn. This overlap creates an ideal zone for traders to enter the market, as it combines two powerful technical signals.
The Unicorn Model is therefore considered an optimal strategy for identifying precise entry and exit points in the financial markets.
Demand ICT Unicorn Model :
Supply ICT Unicorn Model :
🔵 How to Use
🟣 Bullish ICT Unicorn
The Bullish ICT Unicorn model is applicable when the market is in an uptrend, and traders are seeking buying opportunities.
Follow these steps to identify Bullish ICT Unicorn :
Identify the Bullish Breaker Block : Locate an area where the price moved upward after breaking an Order Block. This area now acts as a Breaker Block.
Identify the Bullish FVG : Look for a Fair Value Gap near the Breaker Block.
Confirm the Unicorn : When the Bullish Breaker Block and Bullish FVG overlap, a Bullish Unicorn is confirmed. Traders can enter a buy position when the price returns to this zone.
🟣Bearish ICT Unicorn
The Bearish ICT Unicorn model is used when the market is in a downtrend, and traders are looking for selling opportunities.
To identify Bearish ICT Unicorn, follow these steps :
Identify the Bearish Breaker Block : Find an area where the price moved downward after breaking an Order Block. This area now acts as a Breaker Block.
Identify the Bearish FVG : Check if a Fair Value Gap has formed near the Breaker Block.
Confirm the Unicorn : When the Bearish Breaker Block and Bearish FVG overlap, a Bearish Unicorn is confirmed. Traders can enter a sell position when the price returns to this zone.
🔵 Setting
🟣 Global Setting
Pivot Period of Order Blocks Detector : Enter the desired pivot period to identify the Order Block.
Order Block Validity Period (Bar) : You can specify the maximum time the Order Block remains valid based on the number of candles from the origin.
Mitigation Level Breaker Block : Determining the basic level of a Breaker Block. When the price hits the basic level, the Breaker Block due to mitigation.
Mitigation Level FVG : Determining the basic level of a FVG. When the price hits the basic level, the FVG due to mitigation.
Mitigation Level Unicorn : Determining the basic level of a Unicorn Block. When the price hits the basic level, the Unicorn Block due to mitigation.
🟣 Unicorn Block Display
Show All Unicorn Block : If it is turned off, only the last Order Block will be displayed.
Demand Unicorn Block : Show or not show and specify color.
Supply Unicorn Block : Show or not show and specify color.
🟣 Breaker Block Display
Show All Breaker Block : If it is turned off, only the last Breaker Block will be displayed.
Demand Main Breaker Block : Show or not show and specify color.
Demand Sub (Propulsion & BoS Origin) Breaker Block : Show or not show and specify color.
Supply Main Breaker Block : Show or not show and specify color.
Supply Sub (Propulsion & BoS Origin) Breaker Block : Show or not show and specify color.
🟣 Fair Value Gap Display
Show Bullish FVG : Toggles the display of demand-related boxes.
Show Bearish FVG : Toggles the display of supply-related boxes.
🟣 Logic Settings
🟣 Order Block Refinement
Refine Order Blocks : Enable or disable the refinement feature. Mode selection.
🟣 FVG Filter
FVG Filter : This refines the number of identified FVG areas based on a specified algorithm to focus on higher quality signals and reduce noise.
Types of FVG filters :
Very Aggressive Filter: Adds a condition where, for an upward FVG, the last candle's highest price must exceed the middle candle's highest price, and for a downward FVG, the last candle's lowest price must be lower than the middle candle's lowest price. This minimally filters out FVGs.
Aggressive Filter: Builds on the Very Aggressive mode by ensuring the middle candle is not too small, filtering out more FVGs.
Defensive Filter: Adds criteria regarding the size and structure of the middle candle, requiring it to have a substantial body and specific polarity conditions, filtering out a significant number of FVGs.
Very Defensive Filter: Further refines filtering by ensuring the first and third candles are not small-bodied doji candles, retaining only the highest quality signals.
🟣 Alert
Alert Name : The name of the alert you receive.
Alert ICT Unicorn Model Block Mitigation :
On / Off
Message Frequency :
This string parameter defines the announcement frequency. Choices include: "All" (activates the alert every time the function is called), "Once Per Bar" (activates the alert only on the first call within the bar), and "Once Per Bar Close" (the alert is activated only by a call at the last script execution of the real-time bar upon closing). The default setting is "Once per Bar".
Show Alert Time by Time Zone :
The date, hour, and minute you receive in alert messages can be based on any time zone you choose. For example, if you want New York time, you should enter "UTC-4". This input is set to the time zone "UTC" by default.
🔵Conclusion
The Unicorn Model in ICT, utilizing the concepts of Breaker Blocks and Fair Value Gaps, provides an effective tool for identifying entry and exit points in financial markets. By offering more precise signals, this model helps traders make better decisions and minimize trading risks.
Success in applying this model requires practice and a deep understanding of market structure, but it can significantly improve trading performance.

ICT NWOG/NDOG Gaps [TradingFinder] New Opening Gaps🔵 Introduction
🟣 Understanding ICT Opening Gaps
In the realm of technical analysis, mastering the art of recognizing market behavior and pinpointing key price levels is vital for making sound trading decisions. Among the array of tools available, the concept of opening gaps stands out for its ability to provide crucial insights.
The ICT (Inner Circle Trader) methodology offers a distinctive approach to understanding the importance of New Day Opening Gaps (NDOG), New Week Opening Gaps (NWOG), and New Monthly Opening Gaps (NMOG).
These gaps, representing the price differences between the close of a previous period and the open of the next, serve as key reference points that can greatly impact price movements.
The ICT trading approach highlights these gaps as potential zones of support and resistance. Prices often respond to these areas, either bouncing off or passing through and then retesting them. Within these gaps, significant levels such as the high and low are particularly important.
Additionally, the Event Horizon PD Array (EHPDA) concept, which is an intermediate level calculated from the average of neighboring NWOGs or NDOGs, adds another layer to this analysis.
This guide delves into ICT's New Daily, Weekly, and Monthly Opening Ranges, showing how these gaps can be effectively utilized in trading. By grasping the nuances of these gaps, traders can better forecast market behavior, identify key support and resistance levels, and refine their trading strategies.
🟣 The Gaps
1. New Week Opening Gap (NWOG) : The NWOG is the price gap between Friday's closing price and Sunday's opening price. This gap is particularly crucial for traders who monitor weekly trends. Depending on the direction of the gap, the NWOG often serves as a pivotal support or resistance level.
2. New Day Opening Gap (NDOG) : The NDOG signifies the price difference between the closing price of the previous day and the opening price of the current day. Much like the NWOG, the NDOG is a key reference point for intraday traders.
Prices typically react to these levels, either reversing or continuing through the gap after a retest. NDOGs are instrumental in identifying short-term support and resistance levels, aiding traders in making decisions based on daily price movements.
3. New Monthly Opening Gap (NMOG) : The NMOG represents the gap between the closing price of the previous month and the opening price of the current month.
This gap is especially valuable for traders focusing on long-term trends and macroeconomic factors. As with NWOGs and NDOGs, the NMOG can act as a significant support or resistance level.
🔵 How to Use
Identifying Support and Resistance : Opening gaps often indicate potential zones where prices might reverse or find support/resistance. For example, if a new day opens below the previous day’s close (creating a NDOG), this gap could act as resistance, prompting traders to consider short positions if the price retests this level without breaking through.
Conversely, if the price opens above the previous day’s close, the gap might serve as support, offering a potential entry point for long trades.
Gap Fill Strategy : A popular strategy associated with opening gaps is the "gap fill" approach, where traders anticipate that the price will eventually return to fill the gap.
For instance, if there’s a significant NDOG at market open, a trader might expect the price to retrace back to the previous day’s close, effectively "filling" the gap. This strategy is particularly effective in markets that exhibit mean-reverting behavior.
Combining Gaps with Other Indicators : Traders often enhance their analysis of NDOG, NWOG, and NMOG by integrating other technical indicators. Aligning gap levels with tools such as Fibonacci retracements, moving averages, or existing support and resistance zones can provide additional confirmation for trade entries and exits.
🔵 Setting
Show and Color : You can control the display or non-display of the range as well as the color of the range.
Max Opening Range Update Method : You can control the number of ranges that are updated. If it is "All", all ranges that are not mitigated will be displayed. If "Custom", the ranges will be updated based on the number you specify.
Max Opening Range Update : The number of ranges to update.
🔵 Conclusion
The ICT New Daily, Weekly, and Monthly Opening Ranges provide traders with a systematic approach to understanding market dynamics and identifying critical support and resistance levels.
By analyzing these gaps, traders can gain deeper insights into potential price movements, spot high-probability trade setups, and strengthen their overall trading strategy. Whether you are focused on short-term day trading or long-term market trends, incorporating NDOG, NWOG, and NMOG analysis into your trading plan can be a powerful addition to your toolkit.

ICT Propulsion Block [LuxAlgo]The ICT Propulsion Block indicator is meant to detect and highlight propulsion blocks, which are specific price structures introduced by the Inner Circle Trader (ICT).
Propulsion Blocks are essentially blocks located where prices interact with preceding order blocks. Traders often utilize them when analyzing price movements to identify potential turning points and market behavior or areas of interest in the market.
🔶 USAGE
An order block is a significant area on a price chart where there was a notable accumulation or distribution of orders, often identified by a strong move in price followed by a consolidation or sideways movement. Traders use order blocks to identify potential support or resistance levels.
A Propulsion Block, on the other hand, is a concept taught by the Inner Circle Trader (ICT) and refers to a specific type of order block that interacts with the preceding order block. Traders often analyze propulsion blocks to identify potential turning points and areas of interest in the market.
A mitigated order block refers to an order block that has been invalidated or nullified due to subsequent market movements or developments. It no longer holds the same significance or relevance in the current market context.
Let's explore a bearish order block and propulsion block scenario commonly utilized by ICT traders in their trading strategies.
🔶 SETTINGS
🔹 Order & Propulsion Blocks
Swing Detection Length: Lookback period used to detect swing points for creating order blocks and/or propulsion blocks.
Mitigation Price: Allows users to choose between the closing price or the candle's wick for mitigation.
Highlight Propulsion Block Signals: Highlights the propulsion block and its sentiment for easier identification and analysis.
Remove Unassociated Order Blocks: Eliminate order blocks that are not associated with any propulsion block.
Remove Mitigated Blocks: Eliminates mitigated order blocks and propulsion blocks along with their associated order blocks, streamlining the visualization for clearer analysis.
Most Recent Blocks: Activates processing of the specified number of most recent blocks according to the option. If not enabled, the script defaults to processing the last 125 occurrences.
🔹 Order & Propulsion Blocks Style
Bullish Order & Propulsion Blocks: Toggles the visibility of bullish order and propulsion blocks, along with color customization options.
Bearish Order & Propulsion Blocks: Toggles the visibility of bearish order and propulsion blocks, along with color customization options.
Block Labels: Toggles the visibility of order and propulsion block labels, and label size customization option.
🔶 RELATED SCRIPTS
Order-Blocks-Breaker-Blocks .

Interest Rate and GDP Dashboard by toodegreesDescription:
The Interest Rate and GDP Dashboard is a powerful tool designed to provide traders with valuable insights into Interest Rate and Gross Domestic Product (GDP) of the largest Central Banks.
Interest Rates are closely monitored from all around the world, and play a massive role in Interbank Institutional Trading. Although mainly used by Forex traders, it's important for all types of analysts to understand risk-on and risk-off environments in respective currencies, or other asset classes, based on a global financial landscape.
Forex Pair Dashboard ( FOREXCOM:EURUSD ):
Non-Forex Pair Dashboard ( CME_MINI:ES1! ):
This tool displays the Live Interest Rates (as well as latest Interest Rate Change) and GDP, of the following countries/regions:
Australia
Canada
Europe
Japan
New Zealand
Switzerland
United Kingdom
United States
Further, analysts will be able to see Interest Rate Change labels directly on chart, to monitor Time and price relationship following rate hikes or rate cuts. The labels will display according to the impact of the Interest Rate Change on the current asset on chart, and their tooltips will display the %Change:
Analysts can also choose to mark Interest Rate Changes with vertical lines, to aid in marking changes in sentiment or global financial environment:
The real power and value provided by this tool is its tailored Interest Rate (and GDP) Differential feature for Forex markets, based on the Interest Rate Differential concept as taught by the Inner Circle Trader (ICT).
Using Interest Rate Differentials as a further Long Term Bias factor was introduced by ICT in conjunction with other higher Timeframe principles like Seasonal Tendency, Commitment of Traders, and Open Interest. This fusion ensures a holistic approach to dissecting specific Forex pairs, and the involvement of Institutional traders.
Key Features:
Dynamically calculates and organizes the dashboard to display the interest rate differential of the chart's forex pair, or displays all if outside of forex markets.
Pinpoint historical interest rate changes with precision using vertical lines and/or dynamic labels with tooltips.
Other Features:
Toggle Options: Customize your viewing experience by toggling the display of previous rate changes, enabling or disabling GDP visibility, and tailoring the size and location of the dashboard.
Fine-tune Visuals: Adjust the size and style of the previous interest rate labels and lines to suit your preferences, offering a personalized touch to your analytical workspace.
Usage Guidance:
Add the Interest Rate and GDP Dashboard to your Tradingview chart.
Tailor your experience by customizing the table and style to be in line with your analytical preferences, ensuring a visually engaging and personalized chart.
Observe where and when key Interest Rate decisions impact the macro trend or market environment.
Leverage this invaluable information to shape your Higher Timeframe narrative in confluence with other tools.

ICT Donchian Smart Money Structure (Expo)█ Concept Overview
The Inner Circle Trader (ICT) methodology is focused on understanding the actions and implications of the so-called "smart money" - large institutions and professional traders who often influence market movements. Key to this is the concept of market structure and how it can provide insights into potential price moves.
Over time, however, there has been a notable shift in how some traders interpret and apply this methodology. Initially, it was designed with a focus on the fractal nature of markets. Fractals are recurring patterns in price action that are self-similar across different time scales, providing a nuanced and dynamic understanding of market structure.
However, as the ICT methodology has grown in popularity, there has been a drift away from this fractal-based perspective. Instead, many traders have started to focus more on pivot points as their primary tool for understanding market structure.
Pivot points provide static levels of potential support and resistance. While they can be useful in some contexts, relying heavily on them could provide a skewed perspective of market structure. They offer a static, backward-looking view that may not accurately reflect real-time changes in market sentiment or the dynamic nature of markets.
This shift from a fractal-based perspective to a pivot point perspective has significant implications. It can lead traders to misinterpret market structure and potentially make incorrect trading decisions.
To highlight this issue, you've developed a Donchian Structure indicator that mirrors the use of pivot points. The Donchian Channels are formed by the highest high and the lowest low over a certain period, providing another representation of potential market extremes. The fact that the Donchian Structure indicator produces the same results as pivot points underscores the inherent limitations of relying too heavily on these tools.
While the Donchian Structure indicator or pivot points can be useful tools, they should not replace the original, fractal-based perspective of the ICT methodology. These tools can provide a broad overview of market structure but may not capture the intricate dynamics and real-time changes that a fractal-based approach can offer.
It's essential for traders to understand these differences and to apply these tools correctly within the broader context of the ICT methodology and the Smart Money Concept Structure. A well-rounded approach that incorporates fractals, along with other tools and forms of analysis, is likely to provide a more accurate and comprehensive understanding of market structure.
█ Smart Money Concept - Misunderstandings
The Smart Money Concept is a popular concept among traders, and it's based on the idea that the "smart money" - typically large institutional investors, market makers, and professional traders - have superior knowledge or information, and their actions can provide valuable insight for other traders.
One of the biggest misunderstandings with this concept is the belief that tracking smart money activity can guarantee profitable trading.
█ Here are a few common misconceptions:
Following Smart Money Equals Guaranteed Success: Many traders believe that if they can follow the smart money, they will be successful. However, tracking the activity of large institutional investors and other professionals isn't easy, as they use complex strategies, have access to information not available to the public, and often intentionally hide their moves to prevent others from detecting their strategies.
Instantaneous Reaction and Results: Another misconception is that market movements will reflect smart money actions immediately. However, large institutions often slowly accumulate or distribute positions over time to avoid moving the market drastically. As a result, their actions might not produce an immediate noticeable effect on the market.
Smart Money Always Wins: It's not accurate to assume that smart money always makes the right decisions. Even the most experienced institutional investors and professional traders make mistakes, misjudge market conditions, or are affected by unpredictable events.
Smart Money Activity is Transparent: Understanding what constitutes smart money activity can be quite challenging. There are many indicators and metrics that traders use to try and track smart money, such as the COT (Commitments of Traders) reports, Level II market data, block trades, etc. However, these can be difficult to interpret correctly and are often misleading.
Assuming Uniformity Among Smart Money: 'Smart Money' is not a monolithic entity. Different institutional investors and professional traders have different strategies, risk tolerances, and investment horizons. What might be a good trade for a long-term institutional investor might not be a good trade for a short-term professional trader, and vice versa.
█ Market Structure
The Smart Money Concept Structure deals with the interpretation of price action that forms the market structure, focusing on understanding key shifts or changes in the market that may indicate where 'smart money' (large institutional investors and professional traders) might be moving in the market.
█ Three common concepts in this regard are Change of Character (CHoCH), and Shift in Market Structure (SMS), Break of Structure (BMS/BoS).
Change of Character (CHoCH): This refers to a noticeable change in the behavior of price movement, which could suggest that a shift in the market might be about to occur. This might be signaled by a sudden increase in volatility, a break of a trendline, or a change in volume, among other things.
Shift in Market Structure (SMS): This is when the overall structure of the market changes, suggesting a potential new trend. It usually involves a sequence of lower highs and lower lows for a downtrend, or higher highs and higher lows for an uptrend.
Break of Structure (BMS/BoS): This is when a previously defined trend or pattern in the price structure is broken, which may suggest a trend continuation.
A key component of this approach is the use of fractals, which are repeating patterns in price action that can give insights into potential market reversals. They appear at all scales of a price chart, reflecting the self-similar nature of markets.
█ Market Structure - Misunderstandings
One of the biggest misunderstandings about the ICT approach is the over-reliance or incorrect application of pivot points. Pivot points are a popular tool among traders due to their simplicity and easy-to-understand nature. However, when it comes to the Smart Money Concept and trying to follow the steps of professional traders or large institutions, relying heavily on pivot points can create misconceptions and lead to confusion. Here's why:
Delayed and Static Information: Pivot points are inherently backward-looking because they're calculated based on the previous period's data. As such, they may not reflect real-time market dynamics or sudden changes in market sentiment. Furthermore, they present a static view of market structure, delineating pre-defined levels of support and resistance. This static nature can be misleading because markets are fundamentally dynamic and constantly changing due to countless variables.
Inadequate Representation of Market Complexity: Markets are influenced by a myriad of factors, including economic indicators, geopolitical events, institutional actions, and market sentiment, among others. Relying on pivot points alone for reading market structure oversimplifies this complexity and can lead to a myopic understanding of market dynamics.
False Signals and Misinterpretations: Pivot points can often give false signals, especially in volatile markets. Prices might react to these levels temporarily but then continue in the original direction, leading to potential misinterpretation of market structure and sentiment. Also, a trader might wrongly perceive a break of a pivot point as a significant market event, when in fact, it could be due to random price fluctuations or temporary volatility.
Over-simplification: Viewing market structure only through the lens of pivot points simplifies the market to static levels of support and resistance, which can lead to misinterpretation of market dynamics. For instance, a trader might view a break of a pivot point as a definite sign of a trend, when it could just be a temporary price spike.
Ignoring the Fractal Nature of Markets: In the context of the Smart Money Concept Structure, understanding the fractal nature of markets is crucial. Fractals are self-similar patterns that repeat at all scales and provide a more dynamic and nuanced understanding of market structure. They can help traders identify shifts in market sentiment or direction in real-time, providing more relevant and timely information compared to pivot points.
The key takeaway here is not that pivot points should be entirely avoided or that they're useless. They can provide valuable insights and serve as a useful tool in a trader's toolbox when used correctly. However, they should not be the sole or primary method for understanding the market structure, especially in the context of the Smart Money Concept Structure.
█ Fractals
Instead, traders should aim for a comprehensive understanding of markets that incorporates a range of tools and concepts, including but not limited to fractals, order flow, volume analysis, fundamental analysis, and, yes, even pivot points. Fractals offer a more dynamic and nuanced view of the market. They reflect the recursive nature of markets and can provide valuable insights into potential market reversals. Because they appear at all scales of a price chart, they can provide a more holistic and real-time understanding of market structure.
In contrast, the Smart Money Concept Structure, focusing on fractals and comprehensive market analysis, aims to capture a more holistic and real-time view of the market. Fractals, being self-similar patterns that repeat at different scales, offer a dynamic understanding of market structure. As a result, they can help to identify shifts in market sentiment or direction as they happen, providing a more detailed and timely perspective.
Furthermore, a comprehensive market analysis would consider a broader set of factors, including order flow, volume analysis, and fundamental analysis, which could provide additional insights into 'smart money' actions.
█ Donchian Structure
Donchian Channels are a type of indicator used in technical analysis to identify potential price breakouts and trends, and they may also serve as a tool for understanding market structure. The channels are formed by taking the highest high and the lowest low over a certain number of periods, creating an envelope of price action.
Donchian Channels (or pivot points) can be useful tools for providing a general view of market structure, and they may not capture the intricate dynamics associated with the Smart Money Concept Structure. A more nuanced approach, centered on real-time fractals and a comprehensive analysis of various market factors, offers a more accurate understanding of 'smart money' actions and market structure.
█ Here is why Donchian Structure may be misleading:
Lack of Nuance: Donchian Channels, like pivot points, provide a simplified view of market structure. They don't take into account the nuanced behaviors of price action or the complex dynamics between buyers and sellers that can be critical in the Smart Money Concept Structure.
Limited Insights into 'Smart Money' Actions: While Donchian Channels can highlight potential breakout points and trends, they don't necessarily provide insights into the actions of 'smart money'. These large institutional traders often use sophisticated strategies that can't be easily inferred from price action alone.
█ Indicator Overview
We have built this Donchian Structure indicator to show that it returns the same results as using pivot points. The Donchian Structure indicator can be a useful tool for market analysis. However, it should not be seen as a direct replacement or equivalent to the original Smart Money concept, nor should any indicator based on pivot points. The indicator highlights the importance of understanding what kind of trading tools we use and how they can affect our decisions.
The Donchian Structure Indicator displays CHoCH, SMS, BoS/BMS, as well as premium and discount areas. This indicator plots everything in real-time and allows for easy backtesting on any market and timeframe. A unique candle coloring has been added to make it more engaging and visually appealing when identifying new trading setups and strategies. This candle coloring is "leading," meaning it can signal a structural change before it actually happens, giving traders ample time to plan their next trade accordingly.
█ How to use
The indicator is great for traders who want to simplify their view on the market structure and easily backtest Smart Money Concept Strategies. The added candle coloring function serves as a heads-up for structure change or can be used as trend confirmation. This new candle coloring feature can generate many new Smart Money Concepts strategies.
█ Features
Market Structure
The market structure is based on the Donchian channel, to which we have added what we call 'Structure Response'. This addition makes the indicator more useful, especially in trending markets. The core concept involves traders buying at a discount and selling or shorting at a premium, depending on the order flow. Structure response enables traders to determine the order flow more clearly. Consequently, more trading opportunities will appear in trending markets.
Structure Candles
Structure Candles highlight the current order flow and are significantly more responsive to structural changes. They can provide traders with a heads-up before a break in structure occurs
-----------------
Disclaimer
The information contained in my Scripts/Indicators/Ideas/Algos/Systems does not constitute financial advice or a solicitation to buy or sell any securities of any type. I will not accept liability for any loss or damage, including without limitation any loss of profit, which may arise directly or indirectly from the use of or reliance on such information.
All investments involve risk, and the past performance of a security, industry, sector, market, financial product, trading strategy, backtest, or individual's trading does not guarantee future results or returns. Investors are fully responsible for any investment decisions they make. Such decisions should be based solely on an evaluation of their financial circumstances, investment objectives, risk tolerance, and liquidity needs.
My Scripts/Indicators/Ideas/Algos/Systems are only for educational purposes!

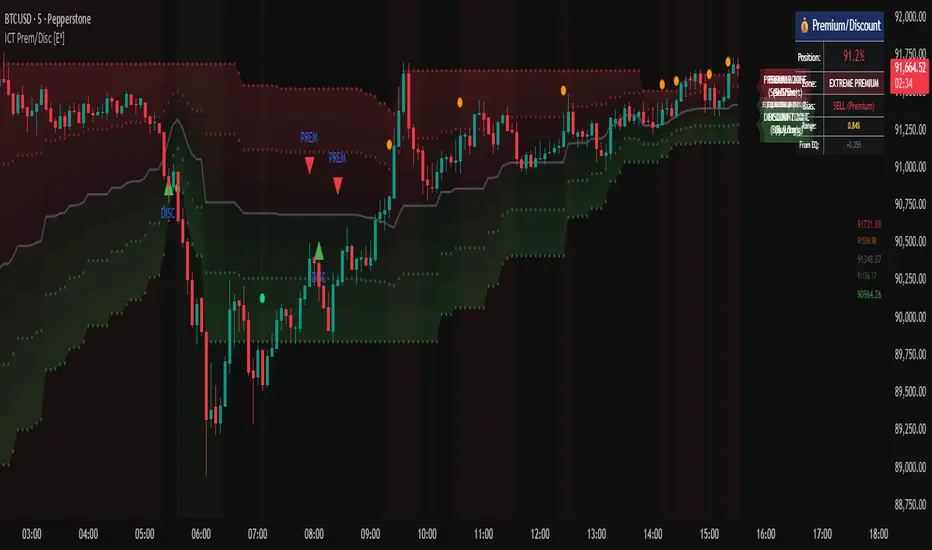
ICT Premium/Discount Zones [Eˣ]💰 Premium/Discount Zones - Free Indicator
Overview
Premium/Discount Zones automatically identifies where price is "expensive" (premium) versus "cheap" (discount) relative to recent price action. Based on ICT (Inner Circle Trader) concepts, this indicator helps you follow the golden rule of trading: "Buy Discount, Sell Premium" - just like institutions do. Know at a glance whether you should be looking for longs, shorts, or staying flat.
━━━━━━━━━━━━━━━━━━━━━━━━━━━━
🎯 What This Indicator Does
Identifies Value Zones:
• 🔴 Premium Zone (50%-100%) - Price above fair value = SELL/SHORT zone
• 🟢 Discount Zone (0%-50%) - Price below fair value = BUY/LONG zone
• ⚖️ Equilibrium (50%) - Fair value center line
• Dynamic calculation based on recent swing range
Zone Classification:
• Extreme Premium (75-100%): Very expensive, strong sell zone
• Premium (61.8-75%): Expensive, sell zone
• Slight Premium (50-61.8%): Slightly expensive, weak sell
• Slight Discount (38.2-50%): Slightly cheap, weak buy
• Discount (25-38.2%): Cheap, buy zone
• Extreme Discount (0-25%): Very cheap, strong buy zone
Professional Features:
• Real-Time Position Tracking - Shows exact percentage (0-100%)
• Beautiful Gradient Visualization - Darker = more extreme
• Key Fibonacci Levels - 25%, 50%, 75%, and golden ratios
• Trading Bias - Clear BUY/SELL/NEUTRAL guidance
• Price Labels - All key levels labeled on chart
• Multiple Visual Styles - Gradient, Solid, or Lines Only
Statistics Panel:
• Current position percentage
• Current zone classification
• Trading bias (BUY/SELL/NEUTRAL)
• Range size
• Distance from equilibrium
━━━━━━━━━━━━━━━━━━━━━━━━━━━━
📚 Understanding Premium/Discount Concept
What Are Premium/Discount Zones?
Think of the market like a store with sales:
• Discount Zone (0-50%): Items on sale - BUY here
• Premium Zone (50-100%): Full price or more - SELL here
• Equilibrium (50%): Fair price - the reference point
The ICT Concept:
Price operates in ranges between swing highs and lows. Within any range:
• The bottom half (0-50%) = Discount = Buy zone
• The top half (50-100%) = Premium = Sell zone
• The middle (50%) = Equilibrium = Fair value
Why This Works:
• Institutional Behavior: Smart money buys discount, sells premium
• Value Principle: Buy low, sell high - but relative to current range
• Mean Reversion: Price tends to return to equilibrium
• Probability: Longs from discount have higher success rate
• Risk/Reward: Better R:R when buying discount, selling premium
Real-World Example:
Imagine BTC trading between $40,000 (low) and $50,000 (high):
• $40,000 - $45,000 = Discount (buy zone) 🟢
• $45,000 = Equilibrium (fair value) ⚖️
• $45,000 - $50,000 = Premium (sell zone) 🔴
If price is at $42,000 (40% position) = Deep discount = Look for LONGS
If price is at $48,000 (80% position) = Extreme premium = Look for SHORTS
━━━━━━━━━━━━━━━━━━━━━━━━━━━━
🎓 The Six Value Zones Explained
Extreme Discount (0-25%)
• What It Means: Price at "rock bottom" of current range
• Institutional Action: Heavy accumulation (buying)
• Your Action: STRONG BUY - Highest probability longs
• Strategy: Aggressive long entries, avoid shorts
• Target: Equilibrium minimum, premium zone ideal
• Stop: Below recent swing low
• Win Rate: 70-80% for long setups
Discount (25-38.2%)
• What It Means: Price is "on sale" but not extreme
• Institutional Action: Moderate accumulation
• Your Action: BUY - Good long opportunities
• Strategy: Long entries with confirmation
• Target: Equilibrium or premium
• Win Rate: 65-75% for longs
Slight Discount (38.2-50%)
• What It Means: Price approaching fair value from below
• Institutional Action: Light buying, some profit-taking
• Your Action: CAUTIOUS BUY - Lower conviction
• Strategy: Only take best setups, tight stops
• Target: Premium zone
• Win Rate: 55-65% for longs
Slight Premium (50-61.8%)
• What It Means: Price above fair value but not extreme
• Institutional Action: Light selling, some buying still
• Your Action: CAUTIOUS SELL - Lower conviction
• Strategy: Take profits on longs, consider shorts
• Target: Equilibrium or discount
• Win Rate: 55-65% for shorts
Premium (61.8-75%)
• What It Means: Price is "expensive" but not extreme
• Institutional Action: Moderate distribution (selling)
• Your Action: SELL - Good short opportunities
• Strategy: Short entries with confirmation
• Target: Equilibrium or discount
• Win Rate: 65-75% for shorts
Extreme Premium (75-100%)
• What It Means: Price at "top" of current range
• Institutional Action: Heavy distribution (selling)
• Your Action: STRONG SELL - Highest probability shorts
• Strategy: Aggressive short entries, avoid longs
• Target: Equilibrium minimum, discount ideal
• Stop: Above recent swing high
• Win Rate: 70-80% for short setups
━━━━━━━━━━━━━━━━━━━━━━━━━━━━
📊 How To Use This Indicator
Strategy 1: Pure Premium/Discount Trading
Best For: Swing trading, range-bound markets
Timeframes: 1H, 4H, Daily
Win Rate: 65-75%
Rules:
1. Wait for price to reach extreme zones (<25% or >75%)
2. Look for reversal confirmation (pin bar, engulfing, etc.)
3. Enter in direction back toward equilibrium
4. Stop: Beyond extreme zone
5. Target 1: Equilibrium (50%)
6. Target 2: Opposite extreme zone
7. Exit all at target 2
Example - Long from Discount:
• Price drops to 20% (extreme discount)
• Bullish pin bar forms
• Enter long at 22%
• Stop at 15%
• Target 1: 50% (take 50% profit)
• Target 2: 75%+ (exit remaining)
Strategy 2: Trend + Premium/Discount
Best For: Trading with higher timeframe trend
Timeframes: Combine Daily trend + 1H entries
Win Rate: 70-80%
Rules:
1. Identify higher timeframe trend (Daily/4H)
2. If uptrend: Only take longs from discount zones
3. If downtrend: Only take shorts from premium zones
4. Enter when price reaches discount/premium in trend direction
5. Stop: Beyond zone
6. Target: Previous high/low
Why It Works: Entering with trend + at value = highest probability
Strategy 3: Equilibrium Rejection
Best For: Quick scalps, day trading
Timeframes: 5min, 15min, 1H
Win Rate: 60-70%
Rules:
1. Price approaches equilibrium (50%)
2. Watch for rejection (immediate reversal)
3. If rejected from below: Enter short (premium target)
4. If rejected from above: Enter long (discount target)
5. Stop: 10-20 pips beyond equilibrium
6. Target: Next major zone (25% or 75%)
Why It Works: Equilibrium acts as magnet and barrier
Strategy 4: Multi-Timeframe Confluence
Best For: Position trading, high conviction trades
Timeframes: Combine Weekly + Daily + 4H
Win Rate: 75-85%
Rules:
1. Check all three timeframes
2. Look for alignment: All in discount OR all in premium
3. If all in discount: STRONG LONG setup
4. If all in premium: STRONG SHORT setup
5. Enter on lowest timeframe
6. Stop: Below/above lowest TF zone
7. Target: Opposite zone on highest TF
Why It Works: Timeframe alignment = institutional consensus
Strategy 5: Order Block + Premium/Discount
Best For: ICT/SMC traders
Timeframes: 15min, 1H, 4H
Win Rate: 75-85%
Rules:
1. Identify Order Block in discount zone (or premium for shorts)
2. Wait for price to reach the OB
3. Confluence of OB + discount = SUPER SETUP
4. Enter on OB test
5. Stop: Beyond OB
6. Target: Premium zone (or discount for shorts)
Why It Works: Double institutional concept = maximum probability
━━━━━━━━━━━━━━━━━━━━━━━━━━━━
⚙️ Settings Explained
Core Settings
Range Detection Length (Default: 50)
• Lookback period for calculating swing high/low
• Lower (20-30): More reactive, follows recent swings
• Higher (100-200): Slower, shows bigger picture range
• Day Trading: 30-50 bars
• Swing Trading: 50-100 bars
• Position Trading: 100-200 bars
• Recommended: 50 for most styles
Display Settings
Show Premium/Discount Zone
• Toggle each zone on/off independently
• Customize colors for each zone
• Tip: Use contrasting colors to your chart theme
Show Equilibrium (50%)
• Toggle the center fair value line
• Most important reference line
• Recommended: Keep ON
Zone Style (Default: Gradient)
• Gradient: Beautiful color gradients, darker at extremes
• Solid: Simple solid boxes
• Lines Only: Minimal lines at key levels only
• Gradient looks best for most charts
Extend to Right
• Projects zones into future bars
• Helpful for planning entries
• Recommended: ON
Additional Levels
Show Key Fib Levels (Default: ON)
• Displays 25% and 75% levels
• These mark extreme discount/premium boundaries
• Critical levels for entries
• Recommended: Keep ON
Show 61.8% / 38.2% (Default: OFF)
• Golden ratio Fibonacci levels
• Additional confluence points
• Can make chart busier
• Use if you trade Fibonacci
Show Zone Labels (Default: ON)
• Displays "PREMIUM ZONE" and "DISCOUNT ZONE" text
• Helpful for learning
• Turn OFF after you're familiar with the zones
Show Price Labels (Default: ON)
• Shows exact prices at key levels
• Appears on right side of chart
• Very useful for setting orders
━━━━━━━━━━━━━━━━━━━━━━━━━━━━
📱 Info Panel Guide
Position (%)
• Shows where price is in the range (0-100%)
• 0% = Bottom of range (extreme discount)
• 50% = Middle (equilibrium)
• 100% = Top of range (extreme premium)
• This is your primary reference number
Zone
• Text description of current position
• 6 possible zones from Extreme Discount to Extreme Premium
• Color-coded for quick reading
• Tells you immediately: should I buy or sell?
Bias
• Simple trading guidance
• BUY (Discount): Position <40% - Look for longs
• SELL (Premium): Position >60% - Look for shorts
• NEUTRAL: Position 40-60% - Be selective
• Follow the bias for highest probability
Range
• Current range size as % of price
• Larger range = More volatility = More opportunity
• Smaller range = Less volatility = Tighter zones
• Example: 5% range = decent volatility
From EQ
• Distance from equilibrium
• Positive (+) = Above equilibrium (premium side)
• Negative (-) = Below equilibrium (discount side)
• Quick reference for mean reversion trades
━━━━━━━━━━━━━━━━━━━━━━━━━━━━
📱 Alert Setup
This indicator includes 5 alert types:
1. Entering Discount Zone
• Fires when price crosses below 50% (equilibrium)
• Action: Start looking for long setups
• Market moving into buy zone
2. Entering Premium Zone
• Fires when price crosses above 50% (equilibrium)
• Action: Start looking for short setups
• Market moving into sell zone
3. Extreme Discount
• Fires when price crosses below 25%
• Action: STRONG BUY opportunity
• Highest probability long setups
4. Extreme Premium
• Fires when price crosses above 75%
• Action: STRONG SELL opportunity
• Highest probability short setups
5. Equilibrium Touch
• Fires when price touches 50% level
• Action: Watch for rejection/breakthrough
• Key decision point
To Set Up Alerts:
1. Click "Alert" button (clock icon)
2. Select "Premium/Discount Zones"
3. Choose your alert type
4. Configure notification method
5. Click "Create"
Pro Tip: Set "Extreme Discount" and "Extreme Premium" alerts for best setups
━━━━━━━━━━━━━━━━━━━━━━━━━━━━
💎 Pro Tips & Best Practices
✅ DO:
• Buy discount, sell premium - The golden rule, simple but effective
• Wait for extremes - Best trades at <25% or >75%
• Use confirmation - Price action, structure, patterns
• Check higher timeframes - HTF discount = strongest longs
• Follow the bias - Indicator tells you: buy, sell, or wait
• Target equilibrium minimum - Always a safe first target
• Scale positions - Bigger size at extreme discount/premium
• Be patient - Wait for price to reach value zones
⚠️ DON'T:
• Don't fade the zone blindly - Always wait for confirmation
• Don't buy premium - Longs from premium have low win rate
• Don't sell discount - Shorts from discount have low win rate
• Don't ignore equilibrium - 50% is critical magnet/barrier
• Don't fight strong trends - Trend can stay in premium/discount longer
• Don't use tight stops - Allow room within the zone
• Don't overtrade neutral - 40-60% range has lower probability
• Don't ignore timeframe alignment - Multi-TF confluence matters
🎯 Best Timeframes:
• Scalping: 5min, 15min (quick moves between zones)
• Day Trading: 15min, 1H (balanced view)
• Swing Trading: 1H, 4H, Daily (major value zones)
• Position Trading: Daily, Weekly (institutional value)
🔥 Best Markets:
• Excellent: Ranging markets, consolidations
• Good: Trending markets (use with HTF trend)
• Best Instruments: Forex, Indices, BTC, ETH (clean ranges)
• Moderate: Stocks (gaps can distort zones)
⏰ When It Works Best:
• Range-bound markets (oscillates between premium/discount)
• Trending markets (pullbacks to discount/premium)
• After breakouts (new range forms, new zones)
• High-volume sessions (London/NY)
━━━━━━━━━━━━━━━━━━━━━━━━━━━━
🎓 Advanced Premium/Discount Concepts
The Equilibrium Magnet
Price is constantly drawn to equilibrium (50%):
• From discount → Moves toward equilibrium (target)
• From premium → Moves toward equilibrium (target)
• At equilibrium → Decides next direction
• Trading: Always target equilibrium minimum on trades
Mean Reversion Principle
The further from equilibrium, the stronger the pull back:
• 90% position → Very high probability of drop toward 50%
• 10% position → Very high probability of rise toward 50%
• Trading: Extreme zones offer best risk/reward
Nested Ranges (Multi-Timeframe)
Larger TF range contains smaller TF ranges:
• Daily range: $40k - $50k (you're at 80% = daily premium)
• 1H range: $48k - $50k (you're at 20% = 1H discount)
• Conflict: Daily says sell, 1H says buy
• Solution: Higher timeframe wins - be cautious on longs
Range Expansion vs Contraction
• Expanding Range: High volatility, larger zones
• Contracting Range: Low volatility, smaller zones
• Trading: Best trades during range expansion
• Watch for breakouts when range contracts too much
Premium/Discount + Fair Value Gaps
When FVG appears in discount zone:
• Bullish FVG in discount = SUPER BUY setup
• Bearish FVG in premium = SUPER SELL setup
• Win Rate: 75-85% (double institutional concepts)
Equilibrium Rejection Strategy
50% level acts as support/resistance:
• Strong rejection from equilibrium = trend continuation
• Multiple tests of equilibrium = preparation for breakout
• Breakthrough equilibrium = trend reversal possible
━━━━━━━━━━━━━━━━━━━━━━━━━━━━
📈 Common Premium/Discount Patterns
Pattern 1: The Perfect Swing
• Price in extreme discount (15%)
• Reversal pattern forms
• Clean move to premium (85%)
• Textbook trade, 70%+ win rate
Pattern 2: The Equilibrium Rejection
• Price approaches 50% from below
• Gets rejected, can't break through
• Returns to discount
• 50% acts as resistance
Pattern 3: The Range Expansion
• Price breaks above old range high
• New premium zone forms at higher level
• Old premium becomes new discount
• Adjust to new range
Pattern 4: The False Premium
• Price briefly enters premium (55%)
• Immediately rejected back to discount
• "Fakeout" or stop hunt
• Actually still discount trade
Pattern 5: The Trend Extension
• Strong trend keeps price in premium for extended time
• Doesn't mean reversal imminent
• Wait for actual reversal signals
• Trend can override value zones
━━━━━━━━━━━━━━━━━━━━━━━━━━━━
🚀 What Makes This Different?
Unlike basic support/resistance, Premium/Discount Zones:
• ICT Methodology - Based on institutional value concepts
• Dynamic Calculation - Always relative to current range
• Clear Trading Bias - Know instantly: buy, sell, or wait
• Beautiful Visualization - Gradient shows intensity
• Multiple Styles - Gradient, solid, or lines
• Real-Time Tracking - Exact position percentage
• Multi-Level System - 6 zones from extreme to extreme
• Simple Yet Powerful - One rule: buy discount, sell premium
Based On Professional Concepts:
• ICT Premium/Discount theory
• Market value principles
• Mean reversion dynamics
• Institutional accumulation/distribution
• Fair value seeking behavior
━━━━━━━━━━━━━━━━━━━━━━━━━━━━
📈 Expected Performance
Based on ICT concepts and trading observations:
Win Rates by Zone:
• Extreme Discount (0-25%) longs: 70-80%
• Discount (25-40%) longs: 65-75%
• Neutral (40-60%) either direction: 50-60%
• Premium (60-75%) shorts: 65-75%
• Extreme Premium (75-100%) shorts: 70-80%
Risk/Reward by Zone:
• Extreme zones: Typically 1:3 to 1:5 R:R
• Standard zones: Typically 1:2 to 1:3 R:R
• Neutral zones: Typically 1:1 to 1:2 R:R
Best Practices:
• Only trade extreme zones (<25%, >75%) = Highest win rate
• Target equilibrium minimum = Always safe
• Use with trend = Add 10-15% to win rate
• Combine with OB/FVG = Add 15-20% to win rate
• Wait for confirmation = Essential
Common Failures:
• Strong trends ignore value zones (20-30% of time)
• Equilibrium can act as barrier instead of target
• Range breakouts invalidate current zones
• Low volatility = zones too tight to trade
━━━━━━━━━━━━━━━━━━━━━━━━━━━━
📈 Upgrade Your Trading Arsenal
This free indicator shows you market value like institutions see it. Want more?
🔥 Check out my premium scripts for:
• Automated Premium/Discount strategies with entries/exits
• Combined Premium/Discount + Order Block + FVG systems
• Multi-timeframe value analysis
• Complete ICT/SMC trading solutions
• Backtested performance tracking
• And much more...
👉 Visit my profile to trade value like the pros!
━━━━━━━━━━━━━━━━━━━━━━━━━━━━
📝 Important Notes
• Premium/Discount is relative to CURRENT range, not absolute
• Ranges change - zones recalculate as new highs/lows form
• Strong trends can stay in premium/discount longer than expected
• Always use confirmation - don't fade zones blindly
• Equilibrium (50%) is the most important reference line
• Best trades at extremes (<25% or >75%)
• Combine with structure, patterns, and risk management
• Works best in ranging and trending pullback scenarios
• Practice identifying value zones before live trading
Learning Curve:
• Week 1: Understand the 6 zones and bias
• Week 2: Practice identifying extreme zones
• Week 3-4: Combine with price action confirmation
• Month 2+: Integrate with Order Blocks and FVGs
Disclaimer: For educational purposes. Premium/Discount trading requires practice. Always use proper risk management.
━━━━━━━━━━━━━━━━━━━━━━━━━━━━
🙏 Support This Work
If this indicator helps you buy discount and sell premium:
• ⭐ Give it a thumbs up
• 💬 Share your best value trades in comments
• 🔔 Follow for more free ICT/SMC tools
• 🚀 Share with traders learning smart money concepts
Questions about Premium/Discount? Drop a comment!
━━━━━━━━━━━━━━━━━━━━━━━━━━━━
Developed with ❤️ for traders who understand the golden rule: Buy Discount, Sell Premium
━━━━━━━━━━━━━━━━━━━━━━━━━━━━
Version History
• v1.0 - Initial release with dynamic range calculation and gradient visualization
ATR/ADR MTF Projection ArrayATR/ADR MTF Projection Array
Overview
A powerful predictive tool that projects ATR (Average True Range) and ADR (Average Daily Range) levels as clean support and resistance arrays on your chart. Designed for traders who want to anticipate the high and low of the day using volatility-based projections with multi-timeframe confluence.
This indicator combines traditional ATR analysis with ICT-style ADR methodology, giving you institutional-grade level projections from a single, customizable tool.
Key Features
🎯 Dual Volatility Metrics
ATR Projections — Classic volatility-based levels with full multi-timeframe support
ADR Projections (ICT Style) — Average Daily Range levels using Inner Circle Trader methodology
Enable/disable each independently based on your trading preference
📊 Multi-Timeframe ATR Analysis
Plot ATR levels from up to 3 timeframes simultaneously (Daily, Weekly, Monthly or custom)
Each timeframe displays with distinct styling for easy identification
Perfect for confluence trading across multiple time horizons
⚡ ICT ADR Methodology
NY Midnight calculation mode (ICT standard) or Classic Daily
Key ICT levels built-in:
1/3 ADR (Judas Swing) — Critical manipulation level where fake moves often terminate
1/2 ADR — Mid-range reference
2/3 ADR — Trending day continuation target
100% ADR — Full daily range completion
150% ADR — Extension target for expansion days
Two projection modes: Static (from anchor) or Dynamic (from session high/low)
🔧 Flexible Anchor Points
Previous Close (default)
Daily Open
Weekly Open
Monthly Open
Session Open
📈 Range Completion Tracking
Real-time display of how much of the expected daily range has been consumed
Visual status indicator helps identify when the day's move may be exhausted
How To Use
For Bias Confirmation:
Establish your directional bias using your preferred method (trigger day, market structure, etc.)
Monitor the 1/3 ADR level during London/NY open for potential Judas Swing (manipulation move)
Target 2/3 to 100% ADR for your HOD/LOD objective
For Target Setting:
Use ATR levels as volatility-based profit targets
ADR 100% level often marks session extremes
When Range Used reaches 100%+, expect consolidation or reversal
For Multi-Timeframe Confluence:
Enable Weekly/Monthly ATR levels alongside Daily
Look for clustering of levels across timeframes for high-probability zones
Settings Guide
Master Controls — Toggle ATR/ADR systems and bull/bear levels independently
ATR Settings — Configure period, multiplier, anchor point, and select which timeframes to display
ATR Level Multipliers — Choose which projection levels to show (0.5x, 0.75x, 1.0x, 1.25x, 1.5x)
ADR Settings (ICT Style) — Select calculation mode (NY Midnight recommended), period (5 days is ICT standard), and projection mode
ADR Level Selection — Toggle individual ICT levels (1/3, 1/2, 2/3, 100%, 150%)
Visual Settings — Customize colors, line styles, labels, and info table position
Alerts Included
ATR 1.0x Bull/Bear Cross
ADR 1/3 Judas Swing Zone (Bull/Bear)
ADR 100% Range Completion (Bull/Bear)

TMT ICT SMC - Hitesh NimjeTMT ICT SMC - Smart Money Concepts
Overview
T
he TMT ICT SMC indicator is a comprehensive, all-in-one toolkit designed for traders utilizing Smart Money Concepts (SMC) and Inner Circle Trader (ICT) methodologies. Developed by Hitesh Nimje (Thought Magic Trading), this script automates the complex task of market structure mapping, order block identification, and liquidity analysis, providing a clear, institutional-grade view of price action.
Whether you are a scalper looking for internal structure shifts or a swing trader analyzing major trend reversals, this tool adapts to your timeframe with precision.
Key Features
1. Market Structure Mapping (Internal & Swing)
* Real-Time Structure: Automatically detects and labels BOS (Break of Structure) and CHoCH (Change of Character).
* Dual-Layer Analysis:
I nternal Structure: Captures short-term momentum and minor shifts for entry refinement.
Swing Structure: Identifies the overarching trend and major pivot points.
* Strong vs. Weak Highs/Lows: visualizes significant swing points to help you identify safe invalidation levels.
* Trend Coloring: Optional feature to color candles based on the active market structure trend.
2. Advanced Order Blocks (OB)
* Auto-Detection: Plots both Internal and Swing Order Blocks automatically.
* Smart Filtering: Includes an ATR or Cumulative Mean Range filter to remove noise and only display significant institutional footprint zones.
* Mitigation Tracking: Choose how order blocks are mitigated (Close vs. High/Low) to keep your chart clean.
3. Liquidity & Gaps
* Fair Value Gaps (FVG): Automatically highlights bullish and bearish imbalances. Includes MTF (Multi-Timeframe) capabilities to see higher timeframe gaps on lower timeframe charts.
* Equal Highs/Lows (EQH/EQL): Marks potential liquidity pools where price often reverses or targets.
4. Multi-Timeframe Levels
* Plots Daily, Weekly, and Monthly High/Low levels directly on your chart to help identify macro support and resistance without switching timeframes.
5. Premium & Discount Zones
* Automatically plots the Fibonacci range of the current price leg to show Premium (expensive), Discount (cheap), and Equilibrium zones, aiding in high-probability entry placement.
Customization
* Style: Switch between a "Colored" vibrant theme or a "Monochrome" minimal theme.
* Control: Every feature can be toggled on/off. Adjust lookback periods, sensitivity thresholds, and colors to match your personal trading style.
* Modes: Choose between "Historical" (for backtesting) and "Present" (for optimized real-time performance).
How to Use
* Trend Confirmation: Use the Swing Structure labels to determine the higher timeframe bias.
* Entry Trigger: Wait for a CHoCH on the Internal Structure within a higher timeframe Order Block or FVG.
* Targeting: Use the Equal Highs/Lows (Liquidity) or opposing Order Blocks as take-profit zones.
Credits
* Author: Hitesh Nimje
* Source: Thought Magic Trading (TMT)
TRADING DISCLAIMER
RISK WARNING
Trading involves substantial risk of loss and is not suitable for all investors. Past performance is not indicative of future results. You should carefully consider whether trading is suitable for you in light of your circumstances, knowledge, and financial resources.
NO FINANCIAL ADVICE
This indicator is provided for educational and informational purposes only. It does not constitute:
* Financial advice or investment recommendations
* Buy/sell signals or trading signals
* Professional investment advice
* Legal, tax, or accounting guidance
LIMITATIONS AND DISCLAIMERS
Technical Analysis Limitations
* Pivot points are mathematical calculations based on historical price data
* No guarantee of accuracy of price levels or calculations
* Markets can and do behave irrationally for extended periods
* Past performance does not guarantee future results
* Technical analysis should be used in conjunction with fundamental analysis
Data and Calculation Disclaimers
* Calculations are based on available price data at the time of calculation
* Data quality and availability may affect accuracy
* Pivot levels may differ when calculated on different timeframes
* Gaps and irregular market conditions may cause level failures
* Extended hours trading may affect intraday pivot calculations
Market Risks
* Extreme market volatility can invalidate all technical levels
* News events, economic announcements, and market manipulation can cause gaps
* Liquidity issues may prevent execution at calculated levels
* Currency fluctuations, inflation, and interest rate changes affect all levels
* Black swan events and market crashes cannot be predicted by technical analysis
USER RESPONSIBILITIES
Due Diligence
* You are solely responsible for your trading decisions
* Conduct your own research before using this indicator
* Verify calculations with multiple sources before trading
* Consider multiple timeframes and confirm levels with other technical tools
* Never rely solely on one indicator for trading decisions
Risk Management
* Always use proper risk management and position sizing
* Set appropriate stop-losses for all positions
* Never risk more than you can afford to lose
* Consider the inherent risks of leverage and margin trading
* Diversify your portfolio and trading strategies
Professional Consultation
* Consult with qualified financial advisors before trading
* Consider your tax obligations and legal requirements
* Understand the regulations in your jurisdiction
* Seek professional advice for complex trading strategies
LIMITATION OF LIABILITY
Indemnification
The creator and distributor of this indicator shall not be liable for:
* Any trading losses, whether direct or indirect
* Inaccurate or delayed price data
* System failures or technical malfunctions
* Loss of data or profits
* Interruption of service or connectivity issues
No Warranty
This indicator is provided "as is" without warranties of any kind:
* No guarantee of accuracy or completeness
* No warranty of uninterrupted or error-free operation
* No warranty of merchantability or fitness for a particular purpose
* The software may contain bugs or errors
Maximum Liability
In no event shall the liability exceed the purchase price (if any) paid for this indicator. This limitation applies regardless of the theory of liability, whether contract, tort, negligence, or otherwise.
REGULATORY COMPLIANCE
Jurisdiction-Specific Risks
* Regulations vary by country and region
* Some jurisdictions prohibit or restrict certain trading strategies
* Tax implications differ based on your location and trading frequency
* Commodity futures and options trading may have additional requirements
* Currency trading may be regulated differently than stock trading
Professional Trading
* If you are a professional trader, ensure compliance with all applicable regulations
* Adhere to fiduciary duties and best execution requirements
* Maintain required records and reporting
* Follow market abuse regulations and insider trading laws
TECHNICAL SPECIFICATIONS
Data Sources
* Calculations based on TradingView data feeds
* Data accuracy depends on broker and exchange reporting
* Historical data may be subject to adjustments and corrections
* Real-time data may have delays depending on data providers
Software Limitations
* Internet connectivity required for proper operation
* Software updates may change calculations or functionality
* TradingView platform dependencies may affect performance
* Third-party integrations may introduce additional risks
MONEY MANAGEMENT RECOMMENDATIONS
Conservative Approach
* Risk only 1-2% of capital per trade
* Use position sizing based on volatility
* Maintain adequate cash reserves
* Avoid over-leveraging accounts
Portfolio Management
* Diversify across multiple strategies
* Don't put all capital into one approach
* Regularly review and adjust trading strategies
* Maintain detailed trading records
FINAL LEGAL NOTICES
Acceptance of Terms
* By using this indicator, you acknowledge that you have read and understood this disclaimer
* You agree to assume all risks associated with trading
* You confirm that you are legally permitted to trade in your jurisdiction
Updates and Changes
* This disclaimer may be updated without notice
* Continued use constitutes acceptance of any changes
* It is your responsibility to stay informed of updates
Governing Law
* This disclaimer shall be governed by the laws of the jurisdiction where the indicator was created
* Any disputes shall be resolved in the appropriate courts
* Severability clause: If any part of this disclaimer is invalid, the remainder remains enforceable
REMEMBER: THERE ARE NO GUARANTEES IN TRADING. THE MAJORITY OF RETAIL TRADERS LOSE MONEY. TRADE AT YOUR OWN RISK.
Contact Information:
* Creator: Hitesh_Nimje
* Phone: Contact@8087192915
* Source: Thought Magic Trading
© HiteshNimje - All Rights Reserved
This disclaimer should be prominently displayed whenever the indicator is shared, sold, or distributed to ensure users are fully aware of the risks and limitations involved in trading.

HTCTS - Session & Time LiquidityHTCTS - Session & Time Liquidity
1. ภาพรวมการทำงาน (Overview)
อินดิเคเตอร์ตัวนี้ทำหน้าที่ 4 อย่างหลักพร้อมกัน:
Auto DST (ปรับเวลาตามฤดูอัตโนมัติ): คุณไม่ต้องมานั่งแก้เวลาเมื่อตลาดต่างประเทศเปลี่ยนเวลา (Daylight Saving Time) เพราะโค้ดอ้างอิง Timezone ของตลาดนั้นๆ โดยตรง (เช่น NY ใช้ America/New_York)
Session Bars: แสดงแถบสีเล็กๆ ด้านล่างจอเพื่อบอกว่าตอนนี้อยู่ใน Session ไหน (Asia, London, NY AM, NY PM, Thai) แทนการถมสีพื้นหลังซึ่งอาจจะรกตา
High/Low Levels & Sweeps: เมื่อจบ Session โปรแกรมจะตีเส้น High และ Low ของช่วงเวลานั้นทิ้งไว้ ถ้ากราฟวิ่งไปชนเส้นเหล่านั้น (Breakout/Sweep) เส้นจะเปลี่ยนเป็นเส้นประและขึ้นข้อความว่า "(Swept)"
1. Indicator Overview and Purpose (ICT/SMC Framework)
This custom Pine Script indicator is designed specifically for traders utilizing ICT (Inner Circle Trader) or SMC (Smart Money Concepts) methodologies. Its primary function is to simplify the analysis of Time & Price by automatically defining and tracking key market sessions, their resulting liquidity levels (High/Low), and detecting liquidity sweeps (Stop Hunts).
The indicator is designed to be Zero-Maintenance regarding time zones, as it automatically adjusts for Daylight Saving Time (DST) changes in major financial centers (London, New York).
2. Key Features and Logic
A. Automatic DST Handling (Auto-DST)
The script uses specific, location-based time zones for global markets instead of a fixed GMT/UTC offset.
Asia: Uses Asia/Tokyo.
London: Uses Europe/London (Automatically adjusts for BST).
New York (AM/PM): Uses America/New_York (Automatically adjusts for EST/EDT).
This guarantees that the session times displayed on your chart (regardless of your local time, e.g., Thailand GMT+7) always align with the actual opening and closing moments of the corresponding financial market.

One for AllOne for All (OFA) - Complete ICT Analysis Suite
Version 3.3.0 by theCodeman
📊 Overview
One for All (OFA) is a comprehensive TradingView indicator designed for traders who follow Inner Circle Trader (ICT) concepts. This all-in-one tool combines essential ICT analysis features—sessions, kill zones, previous period levels, and higher timeframe candles with Fair Value Gaps (FVGs) and Volume Imbalances (VIs)—into a single, highly customizable indicator. Whether you're a beginner learning ICT concepts or an experienced trader refining your edge, OFA provides the visual structure needed for precise market analysis and execution.
✨ Key Features
- 🏷️ Customizable Watermark**: Display your trading identity with customizable titles, subtitles, symbol info, and full style control
- 🌍 Trading Sessions**: Visualize Asian, London, and New York sessions with high/low lines, range boxes, and open/close markers
- 🎯 Kill Zones**: Highlight 5 critical ICT kill zones with precise timing and visual boxes
- 📈 Previous Period H/L**: Track Daily, Weekly, and Monthly highs/lows with customizable styles and lookback periods
- 🕐 Higher Timeframe Candles**: Display up to 5 HTF timeframes with OHLC trace lines, timers, and interval labels
- 🔍 FVG & VI Detection**: Automatically detect and visualize Fair Value Gaps and Volume Imbalances on HTF candles
- ⚙️ Universal Timezone Support**: Works globally with GMT-12 to GMT+14 timezone selection
- 🎨 Full Customization**: Control colors, styles, visibility, and layout for every feature
🚀 How to Use
Watermark Setup
The watermark overlay helps you identify your charts and maintain focus on your trading principles:
1. Enable/disable watermark via "Show Watermark" toggle
2. Customize the title (default: "Name") to display your trading name or account identifier
3. Set up to 3 subtitles (default: "Patience", "Confidence", "Execution") as trading reminders
4. Choose position (9 locations available), size, color, and transparency
5. Toggle symbol and timeframe display as needed
Use Case: Display your trading principles or account name for multi-monitor setups or content creation.
Trading Sessions Analysis
Sessions define market character and liquidity availability:
1. Enable "Show All Sessions" to visualize all three sessions
2. Adjust timezone to match your local market (default: UTC-5 for EST)
3. Customize session times if needed (defaults cover standard hours)
4. Enable session range boxes to see consolidation zones
5. Use session high/low lines to identify key levels for the current session
6. Enable open/close markers to track session transitions
Use Case: Identify which session you're trading in, track session highs/lows for liquidity, and anticipate session transition volatility.
Kill Zones Trading
Kill zones are ICT's high-probability trading windows:
1. Enable individual kill zones or use "Show All Kill Zones"
2. **Asian Kill Zone** (2000-0000 GMT): Early positioning and smart money accumulation
3. **London Kill Zone** (0300-0500 GMT): European market opening volatility
4. **NY AM Kill Zone** (0930-1100 EST): Post-NYSE open expansion
5. **NY Lunch Kill Zone** (1200-1300 EST): Midday consolidation or manipulation
6. **NY PM Kill Zone** (1330-1600 EST): Afternoon positioning and closes
7. Customize colors and times to match your trading style
8. Set max days display to control historical visibility (default: 30 days)
Use Case: Focus entries during high-probability windows. Watch for liquidity sweeps at kill zone openings and institutional positioning.
Previous Period High/Low Levels
Previous period levels act as magnetic price targets and support/resistance:
1. Enable Daily (PDH/PDL), Weekly (PWH/PWL), or Monthly (PMH/PML) levels individually
2. Set lookback period (how many previous periods to display)
3. Choose line style: Solid (current emphasis), Dashed (standard), or Dotted (subtle)
4. Customize colors per timeframe for visual hierarchy
5. Adjust line width (1-5) for visibility preference
6. Enable gradient effect to fade older periods
7. Position labels left or right based on chart layout
8. Customize label text for your preferred notation
Use Case: Identify key levels where price is likely to react. Daily levels work on intraday timeframes, Weekly on daily charts, Monthly for swing trading.
Higher Timeframe (HTF) Candles
HTF candles reveal the larger market context while trading lower timeframes:
1. Enable up to 5 HTF slots simultaneously (default: 5m, 15m, 1H, 4H, Daily)
2. Choose display mode: "Below Chart" (stacked rows) or "Right Side" (compact column)
3. Customize timeframe, colors (bull/bear), and titles for each slot
4. **OHLC Trace Lines**: Visual lines connecting HTF candle levels to chart bars
5. **HTF Timer**: Countdown showing time remaining until HTF candle close
6. **Interval Labels**: Display day of week (Daily+) or time (intraday) on each candle
7. For Daily candles: Choose open time (Midnight, 8:30, 9:30) to match your market structure preference
Use Case: Trade lower timeframes while respecting higher timeframe structure. Watch for HTF candle closes to confirm directional bias.
FVG & VI Detection
Fair Value Gaps and Volume Imbalances highlight inefficiencies that price often revisits:
1. **Fair Value Gaps (FVGs)**: Detected when HTF candle wicks don't overlap between 3 consecutive candles
- Bullish FVG: Gap between candle 1 high and candle 3 low (green box by default)
- Bearish FVG: Gap between candle 1 low and candle 3 high (red box by default)
2. **Volume Imbalances (VIs)**: Similar detection but focuses on body gaps
- Bullish VI: Gap between candle 1 close and candle 3 open
- Bearish VI: Gap between candle 1 open and candle 3 close
3. Enable FVG/VI detection per HTF slot individually
4. Customize colors and transparency for each imbalance type
5. Boxes appear on chart at formation and remain visible as retracement targets
**Use Case**: Identify high-probability retracement zones. Price often returns to fill FVGs and VIs before continuing the trend. Use as entry zones or profit targets.
🎨 Customization
OFA is built for flexibility. Every feature includes extensive customization options:
Visual Customization
- **Colors**: Independent color control for every element (sessions, kill zones, lines, labels, FVGs, VIs)
- **Transparency**: Adjust box and label transparency (0-100%) for clean charts
- **Line Styles**: Choose Solid, Dashed, or Dotted for previous period lines
- **Sizes**: Control text size, line width, and box borders
- **Positions**: Place watermark in 9 positions, labels left/right
Layout Control
- **HTF Display Mode**: "Below Chart" for detailed analysis, "Right Side" for space efficiency
- **Drawing Limits**: Set max days for sessions/kill zones to manage chart clutter
- **Lookback Periods**: Control how many previous periods to display (1-10)
- **Gradient Effects**: Enable fading for older previous period lines
Timing Adjustments
- **Timezone**: Universal GMT offset selector (-12 to +14) for global markets
- **Session Times**: Customize each session's start/end times
- **Kill Zone Times**: Adjust kill zone windows to match your market's characteristics
- **Daily Open**: Choose Midnight, 8:30, or 9:30 for Daily HTF candle open time
💡 Best Practices
1. Start Simple: Enable one feature at a time to learn how each element affects your analysis
2. Match Your Timeframe: Use Daily levels on intraday charts, Weekly on daily charts, HTF candles one or two levels above your trading timeframe
3. Kill Zone Focus: Concentrate your trading activity during kill zones for higher probability setups
4. HTF Confirmation: Wait for HTF candle closes before committing to directional bias
5. FVG/VI Entries: Look for price to return to unfilled FVGs/VIs for entry opportunities with favorable risk/reward
6. Customize Colors: Use a consistent color scheme that matches your chart theme and reduces visual fatigue
7. Reduce Clutter: Disable features you're not actively using in your current trading plan
8. Session Context: Understand which session controls the market—trade with session direction or anticipate reversals at session transitions
⚙️ Settings Guide
OFA organizes settings into logical groups for easy navigation:
- **═══ WATERMARK ═══**: Title, subtitles, position, style, symbol/timeframe display
- **═══ SESSIONS ═══**: Enable/disable sessions, times, colors, high/low lines, boxes, markers
- **═══ KILL ZONES ═══**: Individual kill zone toggles, times, colors, max days display
- **═══ PREVIOUS H/L - DAILY ═══**: Daily high/low lines, style, color, lookback, labels
- **═══ PREVIOUS H/L - WEEKLY ═══**: Weekly high/low lines, style, color, lookback, labels
- **═══ PREVIOUS H/L - MONTHLY ═══**: Monthly high/low lines, style, color, lookback, labels
- **═══ HTF CANDLES ═══**: Global display mode, layout settings
- **═══ HTF SLOT 1-5 ═══**: Individual HTF configuration (timeframe, colors, title, FVG/VI detection, trace lines, timer, interval labels)
Each setting includes tooltips explaining its function. Hover over any input for detailed guidance.
📝 Final Notes
One for All (OFA) represents a complete ICT analysis toolkit in a single indicator. By combining watermark customization, session visualization, kill zone highlighting, previous period levels, and higher timeframe candles with FVG/VI detection, OFA eliminates the need for multiple indicators cluttering your chart.
**Version**: 3.3.0
**Author**: theCodeman
**Pine Script**: v6
**License**: Mozilla Public License 2.0
Start with default settings to learn the indicator's structure, then customize extensively to match your personal trading style. Remember: tools provide information, but your edge comes from disciplined execution of a proven strategy.
Happy Trading! 📈

ICT Fair Value Gap (FVG) Detector │ Auto-Mitigated │ 2025Accurate ICT / Smart Money Concepts Fair Value Gap (FVG) detector
Features:
• Detects both Bullish (-FVG) and Bearish (+FVG) using strict 3-candle rule
• Boxes automatically extend right until price mitigates them
• Boxes auto-delete when price closes inside the gap (true mitigation)
• No repainting – 100% reliable
• Clean, lightweight, and works on all markets & timeframes
• Fully customizable colors and transparency
How to use:
– Bullish FVG (green) = potential support / buy zone in uptrend
– Bearish FVG (red) = potential resistance / sell zone in downtrend
Exactly matches The Inner Circle Trader (ICT) methodology used by thousands of SMC traders in 2024–2025.
Enjoy and trade safe!

HD Trades📊 ICT Confluence Toolkit (FVG, OB, SMT)
This All-in-One indicator is designed for Smart Money Concepts (SMC) traders, providing visual confirmation and signaling for three critical Inner Circle Trader (ICT) tools directly on your chart: Fair Value Gaps (FVG), Order Blocks (OB), and Smart Money Technique (SMT) Divergence.
It eliminates the need to load multiple indicators, streamlining your analysis for high-probability setups.
🔑 Key Features
1. Fair Value Gaps (FVG)
Automatic Detection: Instantly highlights bullish (buy-side) and bearish (sell-side) imbalances using the standard three-candle pattern.
Real-Time Mitigation: Gaps are drawn until price trades into the FVG zone, at which point the indicator automatically "mitigates" and removes the box, ensuring your chart stays clean.
2. Order Blocks (OB)
Impulse-Based Logic: Identifies valid Order Blocks (the last opposing candle) confirmed by a strong, structure-breaking impulse move, quantified using an Average True Range (ATR) multiplier for dynamic sensitivity.
Mitigation Tracking: Bullish OBs are tracked until broken below the low, and Bearish OBs until broken above the high, distinguishing between active supply/demand zones.
3. SMT Divergence (Smart Money Technique)
Multi-Asset Comparison: Utilizes the Pine Script request.security() function to compare the swing structure of the current chart against a correlated asset (e.g., EURUSD vs. GBPUSD, or ES vs. NQ).
Signal Labels: Plots clear 🐂 SMT (Bullish) or 🐻 SMT (Bearish) labels directly on the chart when a divergence in market extremes is detected, signaling a potential reversal or continuation based on internal market weakness.
⚙️ Customization
All three components are toggleable and feature customizable colors and lookback periods, allowing you to fine-tune the indicator to your specific trading strategy and preferred timeframes.
Crucial Setup: For SMT Divergence to function, you must enter a correlated symbol (e.g., NQ1!, ES1!, or a related Forex pair) in the indicator settings.

TJR Bogdan Pro (Cleaned)This indicator is designed to automate the "Bogdan" scalping strategy popularized by TJR Trades. It simplifies complex ICT (Inner Circle Trader) concepts into a visual, easy-to-read "Traffic Light" system.
Instead of guessing where the market is going, this tool helps you identify the specific narrative of Liquidity Sweeps (Turtle Soup) followed by a Change of Character (CHoCH).
It answers the three most important questions in trading:
1. Where do I look? (Key Levels)
2. When do I act? (Liquidity Grab + Structure Shift)
3. Where do I enter? (Fair Value Gap)
How to Trade This Indicator
This script is best used on the 5-Minute Timeframe. It automatically pulls Higher Timeframe (HTF) levels onto your chart so you don't have to draw them manually.
The 4-Step "Sniper" Sequence
1. The Battlefield (Wait for the Level)
* The script plots the Previous Daily High/Low (PDH/PDL) and 4H High/Low as dashed lines.
* Rule: Do not trade in the middle of nowhere. Wait for the price to touch a dashed line (The Magnet).
2. The Trap (Wait for the "X")
* Symbol: Green X (Bullish) or Red X (Bearish).
* What it means: This is a Liquidity Sweep (or "Grab"). The price poked through a key level to trap traders, but the candle closed back inside. This is your warning that a reversal might happen.
3. The U-Turn (Wait for the Triangle)
* Symbol: Blue ▲ (Bullish) or Orange ▼ (Bearish).
* What it means: This is a CHoCH (Change of Character). The price has broken the recent structure, confirming that the trend has flipped direction.
4. The Entry (Wait for the Box)
* Symbol: Blue Box (Buy Zone) or Orange Box (Sell Zone).
* What it means: This is a Fair Value Gap (FVG).
* Action: Don't chase the price! Wait for the candle to dip back into the Colored Box. Place your entry there with a Stop Loss below the recent low.
Visual Legend
Symbol Concept Direction Narrative
Dashed Lines Key Levels Neutral The "Gas Stations" where liquidity hides.
Green X Sweep (Grab) Bullish Sellers tried to break the floor and failed.
Red X Sweep (Grab) Bearish Buyers tried to break the roof and failed.
Blue ▲ CHoCH Bullish Market structure has shifted UP.
Orange ▼ CHoCH Bearish Market structure has shifted DOWN.
Colored Box FVG Entry The "Discount" zone to enter the trade.

Advanced Time Dividers & Killzones IndicatorOverview
A comprehensive Pine Script v6 indicator that displays customizable time period dividers and trading session killzones on your chart. Perfect for intraday traders who need clear visual separation of time periods and want to identify key trading sessions.
✨ Features
Time Period Dividers
Weekly Lines: Vertical lines marking the start of each week
Monthly Lines: Vertical lines marking the start of each month
Quarterly Lines: Vertical lines marking the start of each quarter (Q1, Q2, Q3, Q4)
Yearly Lines: Vertical lines marking the start of each year
Trading Session Killzones
London Session: 2:00-5:00 GMT (Blue shaded box)
New York Session: 7:00-10:00 GMT (Green shaded box)
London Close: 10:00-12:00 GMT (Orange shaded box)
Asia Session: 20:00-00:00 GMT (Pink shaded box)
🎨 Customization Options
Display Controls
Toggle each time divider type individually
Toggle each killzone individually
Adjust historical and future display range
Show/hide labels on dividers and killzones
Style Customization
Line Styles: Choose between Solid, Dashed, or Dotted lines
Line Width: Adjustable from 1 to 5 pixels
Colors: Fully customizable colors for each element with transparency control
Label Size: Choose from Tiny, Small, Normal, or Large
Period Settings
Control how many bars to display in the past (0-5000)
Control how many bars to display in the future (0-1000)
📋 Usage Instructions
Add to Chart: Add the indicator to any chart
Select Timeframe: Works best on intraday timeframes (1H, 15min, 5min) for killzones
Customize: Open settings to enable/disable features and customize colors
Trading: Use the dividers to identify time periods and killzones to spot high-liquidity sessions
💡 Trading Applications
Time Dividers
Weekly/Monthly Analysis: Identify major time period transitions
Market Structure: Analyze how price behaves at period boundaries
Event Correlation: Align with economic calendar events
Killzones
High Liquidity Periods: Trade during peak market activity
ICT Strategy: Follows Inner Circle Trader killzone concepts
Session-Based Trading: Focus on specific trading sessions
Volatility Windows: Identify when major moves typically occur
⚙️ Technical Details
Version: Pine Script v6
Type: Overlay indicator
Max Lines: 500 (optimized performance)
Max Boxes: 500 (for killzone visualization)
Timezone: GMT/UTC for killzones
Memory Efficient: Automatic cleanup of old objects
🎯 Best Practices
Combine with Price Action: Use dividers to frame your analysis
Focus on Killzones: Most significant price moves occur during these sessions
Adjust Transparency: Find the right balance between visibility and chart clarity
Use Labels Wisely: Toggle labels on/off based on your needs
Timeframe Selection: Use lower timeframes (≤1H) to see killzones clearly
📝 Notes
Killzone times are in GMT/UTC timezone
Works on all instruments (Forex, Crypto, Stocks, Futures)
Optimized for performance with automatic memory management
Fully compatible with other indicators
🔄 Updates & Support
This indicator is actively maintained. Feel free to suggest improvements or report issues in the comments.

ICS🏛️ Institutional Confluence Suite (ICS) Indicator
The Institutional Confluence Suite is a powerful and highly customizable TradingView indicator built to help traders identify key institutional trading concepts across multiple timeframes. It visualizes essential market components like Market Structures (MS), Order Blocks (OB)/Breaker Blocks (BB), Liquidity Zones, and Volume Profile, providing a confluence of institutional price action data.
📈 Key Features & Components
1. Market Structures (MS)
Purpose: Automatically identifies and labels shifts in market trends (Market Structure Shift, MSS) and continuations (Break of Structure, BOS).
Timeframe Detection: You can select detection across Short Term, Intermediate Term, or Long Term swings to match your trading horizon.
Visualization: Plots colored lines (Bullish: Teal, Bearish: Red) to mark the structures and optional text labels (BOS/MSS) for clear identification.
2. Order & Breaker Blocks (OB/BB)
Purpose: Detects and projects potential Supply and Demand zones based on recent price action that led to a swing high or low.
Block Types: Distinguishes between standard Order Blocks and Breaker Blocks (OBs that fail to hold and are traded through, often serving as support/resistance in the opposite direction).
Customization:
Detection Term: Adjusts sensitivity (Short, Intermediate, Long Term).
Display Limit: Sets the maximum number of recent Bullish and Bearish blocks to display.
Price Reference: Option to use the Candle Body (Open/Close) or Candle Wicks (High/Low) to define the block boundaries.
Visualization: Displays blocks as colored boxes (Bullish: Green, Bearish: Red) extending into the future, with a dotted line marking the 50% equilibrium level. Breaker Blocks are indicated by a change in color/line style upon being broken.
3. Buyside & Sellside Liquidity (BSL/SSL)
Purpose: Highlights areas where retail stops/limit orders are likely clustered, often represented by a series of relatively equal highs (Buyside Liquidity) or lows (Sellside Liquidity).
Detection Term: Adjustable sensitivity (Short, Intermediate, Long Term).
Margin: Uses a margin (derived from ATR) to group similar swing points into a single liquidity zone.
Visualization: Plots a line and text label marking the swing point, and a box indicating the clustered liquidity zone.
4. Liquidity Voids (LV) / Fair Value Gaps (FVG)
Purpose: Identifies areas where price moved sharply and inefficiency was created, often referred to as Fair Value Gaps or Imbalances. These are price ranges where minimal trading volume occurred.
Threshold: Uses a multiplier applied to the 200-period ATR to filter for significant gaps.
Mode: Can be set to Present (only show voids near the current price) or Historical (show all detected voids).
Visualization: Fills the price gap with colored boxes (Bullish/Bearish zones), often segmented to represent the price delivery across the gap.
5. Enhanced Liquidity Detection
Purpose: A complementary feature that uses volume and price action to highlight areas of high liquidity turnover, potentially indicating stronger Support and Resistance zones.
Calculation: Utilizes a volume-weighted approach to color-grade liquidity zones based on their significance.
Visualization: Plots shaded boxes (gradient-colored) around swing highs/lows, with text displaying the normalized volume strength.
6. Swing Highs/Lows
Purpose: Directly marks the price points identified as Swing Highs and Swing Lows based on the lookback periods.
Timeframe Detection: Can be enabled for Short Term, Intermediate Term, or Long Term swings.
Visualization: Plots a small colored dot/label (e.g., "⦁") at the swing point.
This indicator is an invaluable tool for traders employing ICT (Inner Circle Trader), Smart Money Concepts (SMC), or general price action strategies, as it automatically aggregates and displays these critical structural and liquidity elements.

Macro Range HighlighterThis Pine Script indicator creates visual boxes that highlight specific time-based price ranges throughout the trading day, operating in New York Eastern Time. It offers two distinct modes: a standard hourly range mode and a classic ICT (Inner Circle Trader) Macro mode.
Two Operating Modes
Mode 1: Standard Hourly 50-09 Ranges (Default)
This mode identifies and highlights the price range during the final 10 minutes of each hour (xx:50) through the first 9 minutes of the next hour (xx:09).
Examples of captured ranges:
08:50 - 09:09
09:50 - 10:09
10:50 - 11:09
11:50 - 12:09
12:50 - 13:09
13:50 - 14:09
14:50 - 15:09
And continues for each hour...
Excluded Time Periods:
The indicator excludes certain periods that cross into or occur during market close and the daily reset:
02:50 - 03:09 (excluded to avoid interference with overnight session)
15:50 - 18:09 (excluded to avoid end-of-regular-hours and the 18:00 ET trading day reset)
This means you will NOT see boxes during the 16:00 or 17:00 hours, as these fall within the excluded window.
Mode 2: Classic ICT Macro Times
When enabled, this mode shows ONLY four specific time windows that are significant in ICT methodology:
02:33 - 02:59 (London Midnight Macro)
04:03 - 04:29 (London Open Macro)
13:10 - 13:39 (New York Lunch Macro)
15:15 - 15:44 (New York Close Macro)
When this mode is active, all standard hourly ranges are disabled, including the 02:50-03:09 range.
Green Line - Open Price
Represents the open price of the first candle when the range begins
This line is static once set - it shows where price opened when entering the time window
Extends horizontally across the entire duration of the box
Example: If the range starts at 08:50 and that candle opens at 18,500, the green line will be drawn at 18,500
Blue Line - Evolving Midpoint
Represents the dynamic midpoint between the range high and range low
This line continuously recalculates as new highs or lows are made within the time window
Calculation: Midpoint = (Range High + Range Low) / 2
Evolution example:
At 08:50, range is 18,480 (low) to 18,520 (high), midpoint = 18,500
At 08:55, price makes new high of 18,540, midpoint updates to 18,510
At 09:02, price makes new low of 18,470, midpoint updates to 18,505
The line visually adjusts up and down as the range expands
Extension: The line extends horizontally from the start of the range to the current bar (or end of range)
This gives traders a visual reference for the "fair value" or equilibrium point of the range
Red Line - Close Price
Represents the close price of the most recent candle within the time window
This line updates continuously with each new bar's close price
Extends horizontally across the range
When the range completes (exits the time window), it shows the final close price of the last bar in the range
Example: As price moves from 08:50 to 09:09, the red line will track the close of each candle: 18,505 → 18,510 → 18,508 → 18,515, etc.
This indicator provides a sophisticated visual framework for analyzing specific time-based price behavior. The evolving midpoint (blue line and optional yellow plot) is particularly powerful because it gives you real-time feedback on where the "fair value" of the range is as it develops, allowing you to make informed decisions about whether price is extended or returning to equilibrium. The three-line system (open/mid/close) creates a complete picture of price action within each critical time window, whether you're using standard hourly analysis or focusing on ICT's specific macro times.

FU Candle Detector (Smart Money Concept) En Anglais🧠 Overall concept: “FU Candle” in Smart Money logic
In the context of Smart Money Concepts (SMC) or ICT (Inner Circle Trader), an FU Candle (also known as a “Fakeout Candle” or “Manipulation Candle”) is a candle that:
Creates an imbalance or a break (often above a swing high or below a swing low),
Attracts liquidity by trapping retail traders (liquidity grab),
Then abruptly reverses direction, revealing the hand of “Smart Money” (large institutions).
It therefore often marks:
The point of manipulation before an impulsive movement (reversal),
An area of interest for entering in the institutional direction (after the liquidity grab).
---
⚙️ How the “FU Candle Detector” script works
The script identifies these candlesticks by observing several typical criteria:
1. Detection of the manipulative candle (FU Candle)
Search for a candlestick that breaks a previous swing (significant high or low),
But closes in the opposite direction, often below/above the broken zone,
Thus indicating a fakeout.
Examples:
Bullish FU Candle: breaks a previous low, but closes bullish.
Bearish FU Candle: breaks a previous high, but closes bearish.
---
2. Visualization on the chart
The script generally displays:
🔴 Red markers for bearish FUs (Fake Breakout upwards),
🟢 Green markers for bullish FUs (Fake Breakout downwards),
🟦 Rectangles of areas of interest (often around the FU Candle Open),
📏 Horizontal lines on areas of imbalance (OB/FVG if integrated).
---
3. Possible additions depending on the version
Depending on the version you have received, the script can also:
Detect Fair Value Gaps (FVG) around FU Candles,
Mark Order Blocks (OB) associated with manipulation,
Add alerts when new FU Candles are detected,
Calculate the distance between the manipulation point and the price return,
Filter according to candle size, volume, or market structure (MSB/CHoCH).
---
🎯 Practical use
FU Candles are often used:
As confirmation of an imminent reversal,
To identify institutional entry zones (hidden Order Block),
To anticipate the direction of the next impulse after the liquidity hunt.
Typical entry example:
> Wait for the formation of an FU Candle + price return within the candle body = entry in the opposite direction to the false breakout.
📈 Recommended combinations
This detector is often combined with:
Structure Break Indicator (CHoCH / BOS)
Liquidity Pool Zones
Fair Value Gap Finder
Order Block Detector
This gives you a complete Smart Money Concept system, capable of mapping:
1. Where liquidity has been taken,
2. Where the price is rebalancing,
3. Where Smart Money is repositioning its orders.

Regular Trading Hours Opening Range Gap (RTH ORG)### Regular Trading Hours (RTH) Gap Indicator with Quartile Levels
**Overview**
Discover overnight gaps in index futures like ES, YM, and NQ, or stocks like SPY, with this enhanced Pine Script v6 indicator. It visualizes the critical gap between the previous RTH close (4:15 PM ET for futures, 4:00 PM for SPY) and the next RTH open (9:30 AM ET), helping traders spot potential price sensitivity formed during after-hours trading.
**Key Features**
- **Standard Gap Boxes**: Semi-transparent boxes highlight the gap range, with optional text labels showing day-of-week and "RTH" identifier.
- **Midpoint Line**: A customizable dashed line at the 50% level, with price labels for quick reference.
- **New: Quartile Lines (25% & 75%)**: Dotted lines (default width 1) mark the quarter and three-quarter points within the gap, ideal for finer intraday analysis. Toggle on/off, adjust style/color/width, and add labels.
- **High-Low Gap Variant**: Optional boxes and midlines for gaps between the prior close's high/low and the open's high/low—perfect for wick-based overlaps on lower timeframes (5-min or below recommended).
- **RTH Close Lines**: Extend previous close levels with dotted lines and price tags.
- **Customization Galore**: Extend elements right, limit historical displays (default: 3 gaps), no-plot sessions (e.g., avoid weekends), and time offsets for non-US indices.
**How to Use**
Apply to 15-min or lower charts for best results. Toggle "extend right" for ongoing levels. SPY auto-adjusts for its 4 PM close.
Tested on major indices—enhance your gap trading strategy today! Questions? Drop a comment.
Thanks to twingall for supplying the original code.
Thanks to The Inner Circle Trader (ICT) for the logical and systematic application.
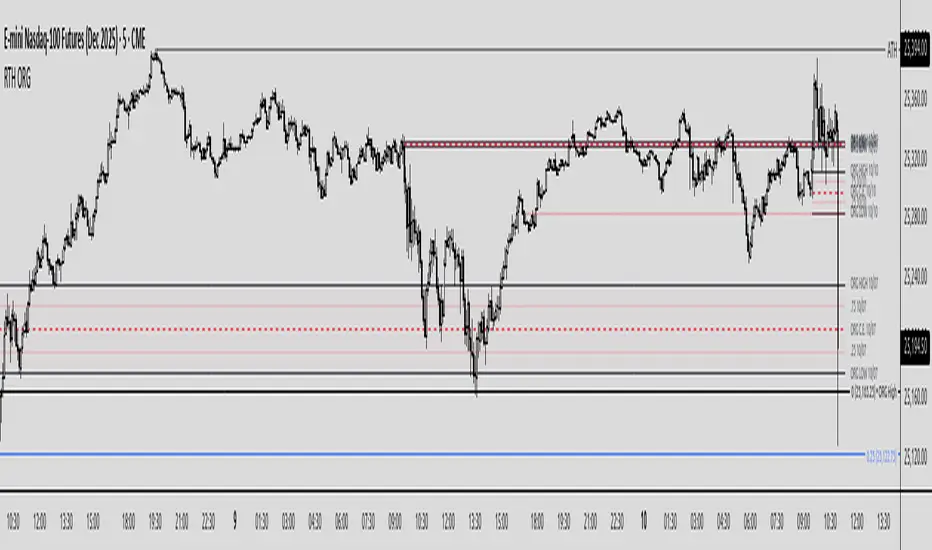
ICT 369 Sniper MSS Indicator (HTF Bias) - H2LThis script is an ICT (Inner Circle Trader) concept-based trading indicator designed to identify high-probability reversal or continuation setups, primarily focusing on intraday trading using a Higher Timeframe (HTF) directional bias.
Here are the four core components of the indicator:
Higher Timeframe (HTF) Bias Filter (Market Structure Shift - MSS): It determines the overall trend by checking if the current price has broken the most recent high or low swing point of a larger timeframe (e.g., 4H). This establishes a Bullish or Bearish bias, ensuring trades align with the dominant trend.
Fair Value Gap (FVG) and OTE: It identifies price imbalances (FVGs) and calculates the Optimal Trade Entry (OTE) levels (50%, 62%, 70.5%, etc.) within those gaps, looking for price to retrace into these specific areas.
Kill Zones (Timing): It incorporates specific time windows (London and New York Kill Zones, based on NY Time) where institutional trading activity is high, only allowing entry signals during these defined periods.
Signal and Targets: It triggers a Long or Short signal when all criteria are met (HTF Bias, FVG, OTE retracement, and Kill Zone timing). It then calculates and plots suggested trade levels, including a Stop Loss (SL) and three Take Profit targets (TP1, TP2, and a dynamic Runner Target based on the weekly Average True Range or ATR).
In summary, it's a comprehensive tool for traders following ICT principles, automating the confluence check across trend, structure, liquidity, and timing.

Custom Time Range HighlightThis indicator highlights specific time ranges on your TradingView chart with customizable background colors and labels, making it easier to identify key trading sessions and ICT (Inner Circle Trader) Killzones. It is designed for traders who want to mark important market hours, such as major sessions (Asia, New York, London) or high-volatility Killzones, with full control over activation, timing, colors, and transparency.
Features
Customizable Time Ranges: Define up to 9 different time ranges, including one custom range, three major market sessions (Asia, New York, London), and five ICT Killzones (Asia, NY Open, NY Close, London Open, London Close).
Individual Activation: Enable or disable each time range independently via checkboxes in the settings. By default, only the ICT Killzones are active.
Custom Colors and Transparency: Set unique background and label colors for each range, with adjustable transparency for both.
Labeled Time Ranges: Each active range is marked with a customizable label at the start of the period, displayed above the chart for easy identification.
Priority Handling: If multiple ranges overlap, the range with the higher number (e.g., Asia Killzone over Custom Range) determines the background color.
CET Time Zone: Time ranges are based on Central European Time (CET, Europe/Vienna). Adjust the hours and minutes to match your trading needs.
Settings
The indicator settings are organized into three groups for clarity:
Custom Range: A flexible range (default: 15:30–18:00 CET) for user-defined periods.
Session - Asia, NY, London: Major market sessions (Asia: 01:00–10:00, New York: 14:00–23:00, London: 09:00–18:00 CET).
ICT Killzones - Asia, NY, London: High-volatility periods (NY Open: 13:00–16:00, NY Close: 20:00–23:00, London Open: 08:00–11:00, London Close: 16:00–18:00, Asia: 02:00–05:00 CET).
For each range, you can:
Toggle activation (default: only ICT Killzones enabled).
Adjust start and end times (hours and minutes).
Customize the label text.
Choose background and label colors with transparency levels (0–100).
How to Use
Add the indicator to your chart.
Open the settings to enable/disable specific ranges, adjust their times, or customize colors and labels.
The chart will highlight active time ranges with the selected background colors and display labels at the start of each range.
Use it to focus on key trading periods, such as ICT Killzones for high-probability setups or major sessions for market analysis.
Notes
Ensure your time ranges align with your trading instrument’s session times.
Overlapping ranges prioritize higher-numbered ranges (e.g., Asia Killzone overrides London Session).
Ideal for day traders, scalpers, or ICT strategy followers who need clear visual cues for specific market hours.
Feedback
If you have suggestions for improvements or need help with customization, feel free to leave a comment or contact the author!

Sunmool's Next Day Model FVG AlertNY Killzone FVG Alert - ICT Fair Value Gap Detection Indicator
This comprehensive Pine Script indicator is specifically designed for traders following ICT (Inner Circle Trader) methodology and Smart Money Concepts. The indicator automatically detects Fair Value Gaps (FVG) that occur during the New York Killzone session, providing real-time alerts when these critical market imbalances are identified.
Key Features:
🎯 Fair Value Gap Detection
Automatically identifies bullish and bearish Fair Value Gaps using the classic 3-candle pattern
Filters gaps based on customizable minimum size thresholds to avoid insignificant imbalances
Provides visual representation through colored boxes and labels for easy identification
⏰ New York Killzone Focus
Specifically monitors the NY Killzone session (default: 7:00 AM - 10:00 AM EST)
Fully customizable session times to accommodate different trading preferences
Only detects FVGs when all three candles forming the gap occur within the killzone timeframe
📅 ICT Next Day Model Compliance
Automatically excludes Mondays from FVG detection as per ICT Next Day Model principles
Optional Monday exclusion can be toggled on/off based on trading strategy
Ensures alignment with professional ICT trading methodologies
🔔 Advanced Alert System
Three distinct alert conditions: Bullish FVG, Bearish FVG, and Combined alerts
Customizable alert messages for different notification preferences
Compatible with TradingView's full alert system including email, SMS, and webhook notifications
🎨 Visual Customization
Adjustable colors for bullish and bearish FVG boxes
Configurable box extension length for better visualization
Optional background highlighting during killzone sessions
Clean, professional chart presentation that doesn't clutter your analysis
📊 Technical Specifications
Works on all timeframes, though most effective on intraday charts (1m, 5m, 15m)
Timezone-aware calculations ensure accurate session detection globally
Efficient code structure minimizes processing load and chart lag
Compatible with other indicators and doesn't interfere with existing chart setups
🎯 Ideal For:
ICT methodology traders seeking automated FVG detection
Smart Money Concepts practitioners
Scalpers and day traders focusing on NY session
Traders looking to identify high-probability entry zones
Anyone interested in market structure and liquidity concepts
📈 Trading Applications:
Fair Value Gaps often serve as areas where price may return to "fill" the imbalance, making them excellent zones for:
Potential reversal areas
Take profit targets
Stop loss placement reference points
Market structure analysis
Confluence with other ICT concepts
⚙️ Customizable Parameters:
FVG minimum size filter
Killzone session start/end times
Visual display options
Alert preferences
Color schemes and styling options
This indicator brings institutional trading concepts to retail traders, helping identify the same market inefficiencies that smart money targets. By focusing specifically on the New York Killzone - one of the most liquid and volatile trading sessions - it provides high-quality signals during optimal market conditions.
Whether you're new to ICT concepts or an experienced trader looking to automate your FVG detection, this indicator provides the precision and reliability needed for professional trading analysis.

IFVG by Toño# IFVG by Toño - Pine Script Indicator
## Overview
This Pine Script indicator identifies and visualizes **Fair Value Gaps (FVG)** and **Inverted Fair Value Gaps (IFVG)** on trading charts. It provides advanced analysis of price inefficiencies and their subsequent inversions when mitigated.
## Key Features
### 1. Fair Value Gap (FVG) Detection
- **Bullish FVG**: Detected when `low > high ` (gap between current low and high of 2 bars ago)
- **Bearish FVG**: Detected when `high < low ` (gap between current high and low of 2 bars ago)
- Visual representation using colored rectangles (green for bullish, red for bearish)
### 2. Inverted Fair Value Gap (IFVG) Creation
- **IFVG Formation**: When a FVG gets mitigated (price fills the gap with candle body), an IFVG is created
- **Color Inversion**: The IFVG takes the opposite color of the original FVG
- Mitigated bullish FVG → Creates red (bearish) IFVG
- Mitigated bearish FVG → Creates green (bullish) IFVG
- **Mitigation Logic**: Uses only candle body (not wicks) to determine when a FVG is filled
### 3. Customizable Display Options
- **Show Normal FVG**: Toggle visibility of regular Fair Value Gaps
- **Show IFVG**: Toggle visibility of Inverted Fair Value Gaps
- **Smart FVG Display**: Even when "Show Normal FVG" is disabled, FVGs that are part of IFVGs remain visible
- **Extension Control**: Option to extend FVGs until they are mitigated
### 4. IFVG Extension Methods
- **Full Cross Method**: IFVG remains active until price completely crosses through it (including wicks)
- **Number of Bars Method**: IFVG remains active for a specified number of bars (1-100)
### 5. Visual Mitigation Signals
- **Cross Markers**: Shows X-shaped markers when IFVGs are mitigated
- Green cross above bar: Bearish IFVG mitigated
- Red cross below bar: Bullish IFVG mitigated
### 6. Comprehensive Alert System
- **IFVG Formation Alerts**: Notifications when new IFVGs are created
- **IFVG Mitigation Alerts**: Notifications when IFVGs are filled/mitigated
- **Separate Controls**: Individual toggles for bullish and bearish IFVG alerts
## How It Works
### Step-by-Step Process:
1. **FVG Detection**: Script continuously scans for 3-bar patterns that create price gaps
2. **FVG Tracking**: Each FVG is stored with its coordinates, type, and status
3. **Mitigation Monitoring**: Script watches for candle bodies that fill the FVG
4. **IFVG Creation**: Upon mitigation, creates an IFVG with opposite polarity at the same location
5. **IFVG Management**: Tracks and extends IFVGs according to chosen method
6. **Visual Updates**: Dynamically updates colors and visibility based on user settings
## Use Cases
- **Support/Resistance Analysis**: IFVGs often act as strong support/resistance levels
- **Market Structure Understanding**: Helps identify how market inefficiencies get filled and reversed
- **Entry/Exit Timing**: Can be used to time entries around IFVG formations or mitigations
- **Confluence Analysis**: Combine with other technical analysis tools for stronger signals
## Configuration Parameters
- **Colors**: Customizable colors for bullish/bearish FVGs and IFVGs
- **Extension**: Choose how long to display gaps on the chart
- **Alerts**: Full control over notification preferences
- **Visual Clarity**: Options to show/hide different gap types for cleaner charts
## Technical Specifications
- **Pine Script Version**: 5
- **Overlay**: True (displays directly on price chart)
- **Max Boxes**: 500 (supports up to 500 simultaneous gaps)
- **Performance**: Optimized array management for smooth operation
This indicator is particularly valuable for traders who use **Smart Money Concepts (SMC)** and **Inner Circle Trader (ICT)** methodologies, as it provides clear visualization of how institutional order flow creates and fills market inefficiencies.
